¶ 1. Abstract
This guide has been created to guide the new T6 Planning installer through the installation, configuration, requirements, and version update process. The T6 Planning Data Provider, also known as SDP, is an add-on developed to enhance report generation in Microsoft SQL Server Reporting Services (SSRS). Designed to simplify the extraction, formatting, and display of data from T6 Planning applications, SDP enables straightforward report development without the need for technical knowledge. Using SQL Server Data Tools (SSDT) for report development, SDP offers various advantages, such as an intuitive graphical interface for data access, hierarchical report creation, improved report execution performance, and the ability to create reports with drill-down in the SQL Server Reporting Services environment.
¶ 2. T6 Planning Data Provider Installation Manual
¶ 2.1 Overview
This manual aims to provide instructions on how to install T6 Planning, as well as configurations, requirements, and version updates, from the perspective of the new T6 Planning installer.
The T6 Planning Data Provider – SDP – is an add-on, also known as an Add-In, developed by the Tech6 Group company. Its purpose is to provide more options and facilities in the development of reports in Microsoft SQL Server Reporting Services – SSRS. It is designed to make the extraction, formatting, and display of data from T6 Planning applications in the form of reports that use Reporting Services simple and without the need for technical knowledge.
Reporting Services is Microsoft's official reporting solution and is included in the SQL Server package. For report development, the SQL Server Data Tools (SSDT) tool is used, depending on the SQL Server used in the environment.
Among all the advantages of using SDP, the following stand out:
- Graphical interface for accessing T6 Planning data.
- Development of hierarchical reports.
- Increased performance in report execution.
- Creation of reports with drill-down.
¶ 3. Prerequisites for Installation
¶ 3.1 Overview
The correct installation of the T6 Planning Data Provider depends on the prior installation of some software. Some requirements are specific to the Client machine, and others are specific to the Server machine.
¶ 3.2 Client Software
This is the machine where reports are created. On this machine, you should install and configure the following software:
- SSDT (SQL Server Data Tools) – You will only install SSDT if the environment uses Reporting Services from version 2010 onwards. In section 1.1.3 of this section, you can find step-by-step instructions for installing this software.
- Microsoft .Net Framework 4.8 or higher:
https://support.microsoft.com/en-us/help/4503548/microsoft-net-framework-4-8-offline-installer-for-windows
¶ 3.3 Server Software
This is the machine where reports are processed. On this machine, you should install and configure the following software:
- T6 Planning Data Provider (SDP).
- Reporting Services 2012 or later.
¶ 4. Installation of SQL Server Data Tools
¶ 4.1 Overview
Microsoft SQL Server Data Tools, or simply SSDT, is a version of Microsoft Visual Studio that provides tools for creating projects specific to the Business Intelligence area.
¶ 4.2 SSDT Installer
To download the SQL Server Data Tools installer, access the following link:
https://docs.microsoft.com/en-us/sql/ssdt/download-sql-server-data-tools-ssdt?view=sql-server-2017#ssdt-for-vs-2017-standalone-installer
- To start the installation, locate the installation file (SSDT-Setup-ENUS.exe) downloaded from the Microsoft website.
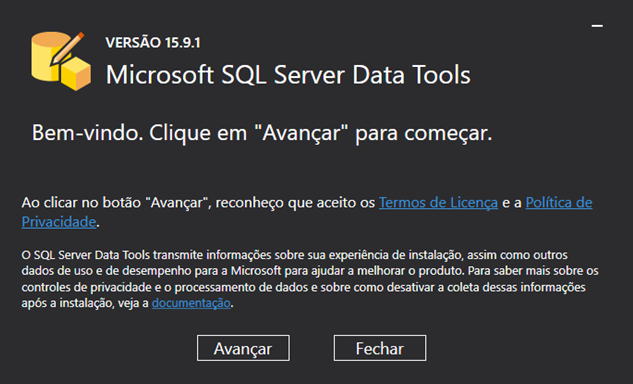
- When starting the installation, the welcome screen will appear. Click Next.
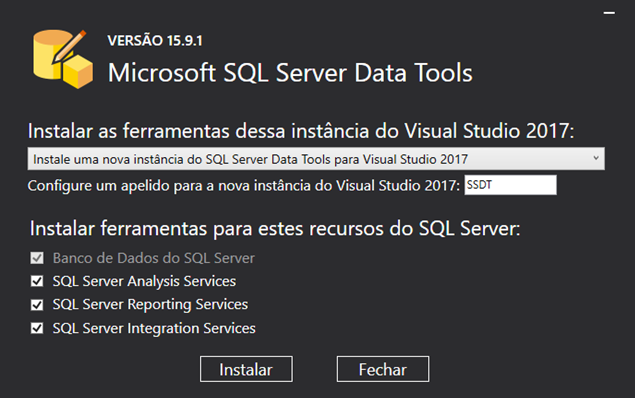
- Select the option Install a new instance of SQL Server Data Tools for Visual Studio 2017, and set a nickname for the new instance.
- Check which SQL Server features you want to install SSDT. For report creation, the Microsoft Reporting Services option is mandatory.
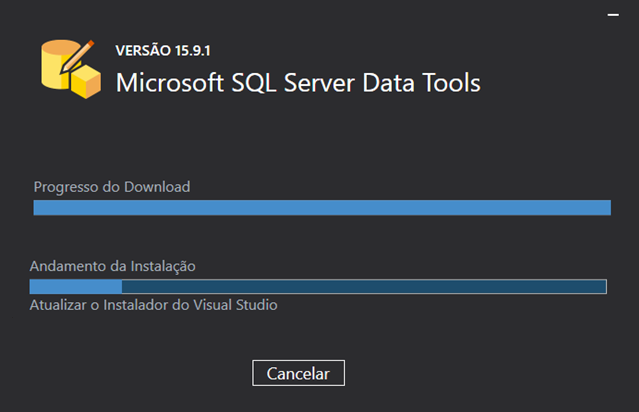
- Follow the installation progress.
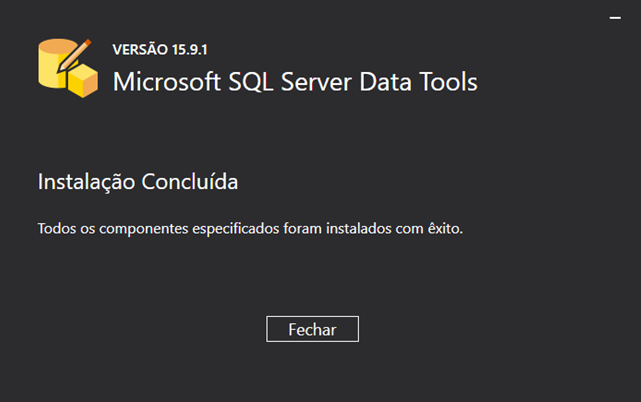
- Installation completed successfully.
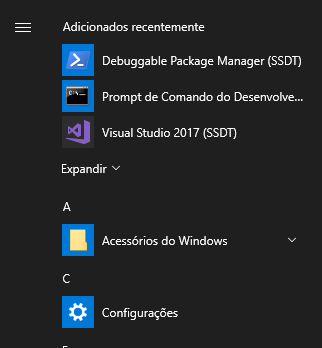
In the Start Menu, you will find SQL Server Data Tools. The corresponding item is called Visual Studio 2017 (SSDT).
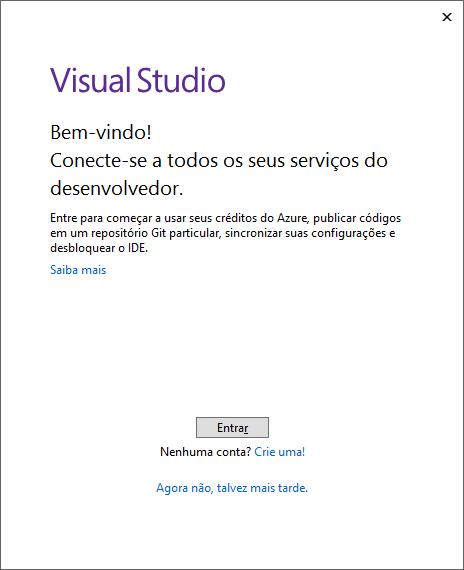
Clicking on this option will display the screen as shown. If you already have a Microsoft account, click the sign-in button and follow the on-screen instructions.
Otherwise, click Not now, maybe later.
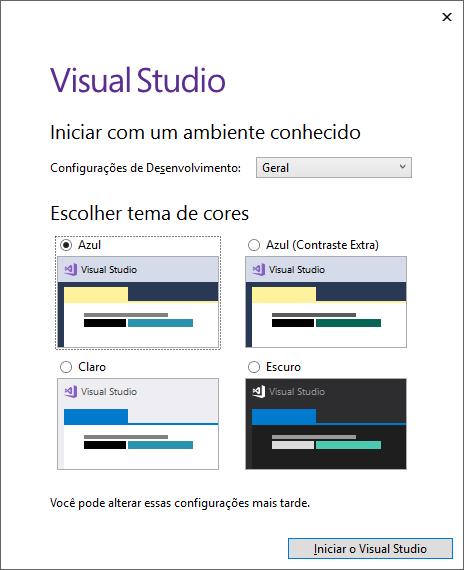
If this is the first time you are running Visual Studio, the screen on the side will be displayed. Choose the option that suits you best and click Start Visual Studio.
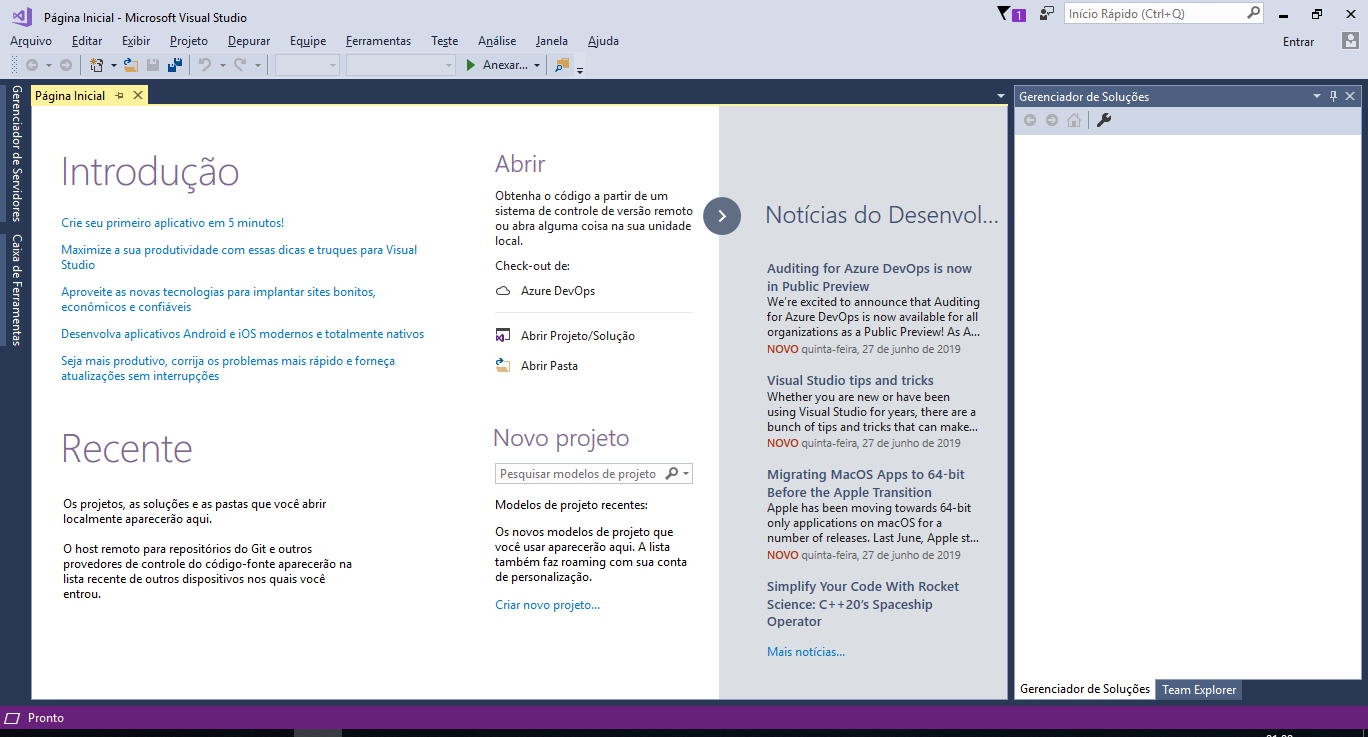
The initial screen of Visual Studio will be displayed as below.
¶ 5. T6 Planning Data Provider Installation
¶ 5.1 Overview
In this chapter, we will cover the installation of the T6 Planning Data Provider (SDP), starting from the moment of extracting the installer and going through the installation itself to the installation testing step.
¶ 5.2 Extracting the Installer
Unzip the contents of the T6 Planning 11.1_xxxxxxx.zip file into a folder of your choice, where a folder called T6 Planning will be created automatically. Open this folder and locate the Installer.exe file. Double-click on it to run the T6 Planning installer.
¶ 5.3 Performing T6 Planning Data Provider Installation
Before starting the T6 Planning Data Provider installation, it's important to note that it can only be performed by a user with Administrator access to the operating system.
The T6 Planning installer supports three installation languages: Portuguese, English, and Spanish. The installation language will be automatically set by the installer based on the user's operating system language.
As mentioned earlier, the T6 Planning Data Provider installation occurs in two steps:
- Client: The installation is performed on the machine responsible for creating reports.
- Server: The installation is performed on the machine with Reporting Services installed.
In both cases, the installation steps are the same. Here are the instructions to execute the installation.
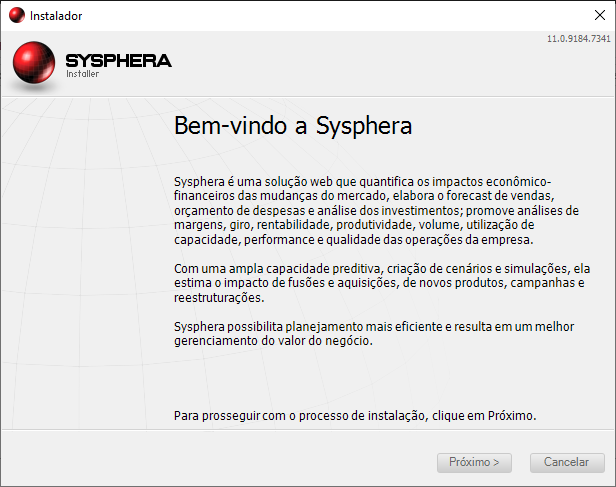
When you run the installer, you will see a brief description of T6 Planning on the initial screen. To proceed with the installation, click the Next button.

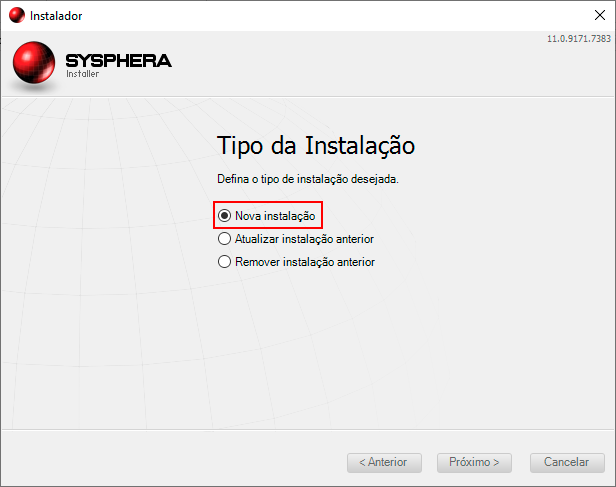
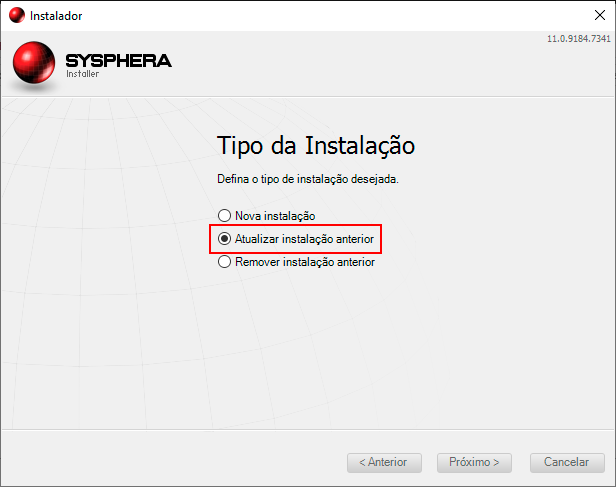
This screen will display the available Installation Types, which are: New Installation, Update Previous Installation, and Remove Previous Installation.
Select the desired installation type and proceed to the next screen.
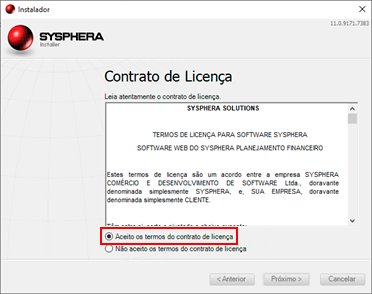
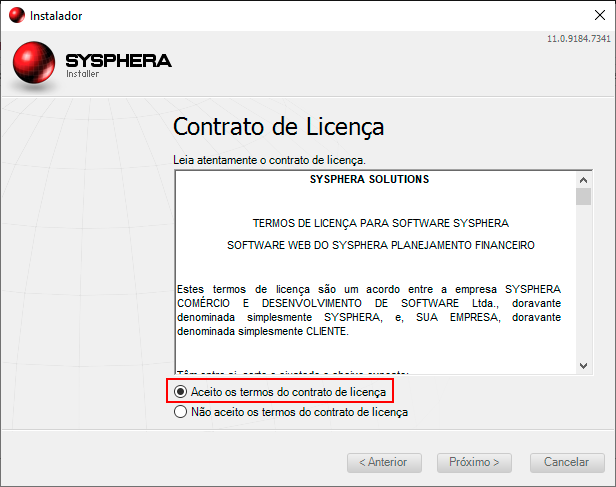
The next screen will display the License Agreement. Read the license terms carefully, and if you disagree, click Cancel to exit the installer. If you agree to the terms, proceed to the next screen.
In the Customer Information screen, you need to enter a valid license file to proceed with the installation.
To obtain the license, access the T6 Planning Support Site and download the license file for the respective version to be installed. Save it in the T6 Planning installation folder.
Click the Browse button, locate the license.xml file, and then proceed to the next screen. If the entered file is invalid, the installer will prevent the process from continuing. If you have any doubts, contact the Commercial department.
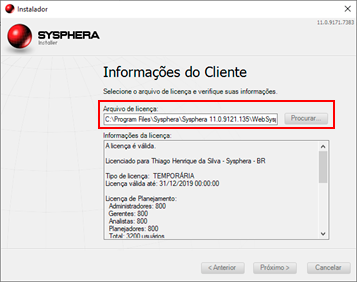
IMPORTANT: If there is already a previous T6 Planning installation, the License File field will automatically display the license.
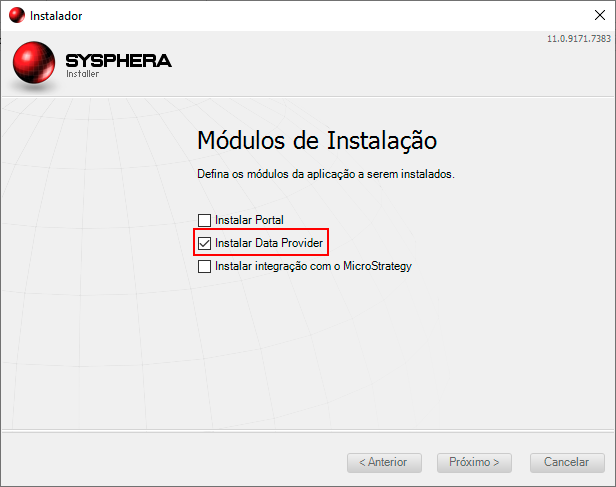
In the Installation Modules screen, you will define the module to be installed for the T6 Planning Data Provider.
Check the Install Data Provider module to install the necessary T6 Planning Data Provider files, as well as the configuration and integration of SDP with the SSDT tool.
Then click the Next button.
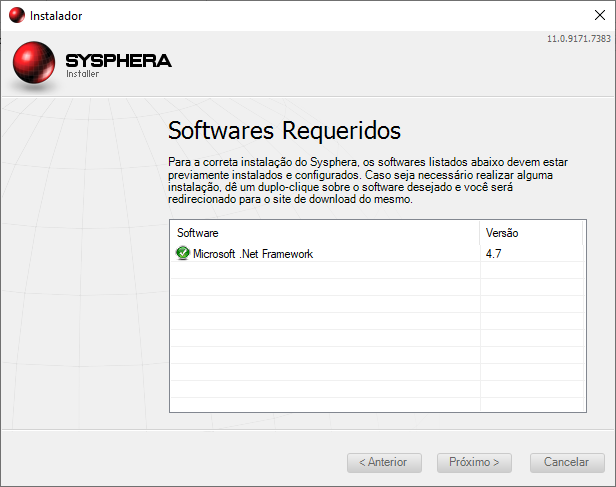
The next screen will display the prerequisites for installation, according to the modules selected on the previous screen. The installer will inform if there are any optional requirements to be installed. If any mandatory prerequisites are not installed, the installer will inform and prevent the T6 Planning installation until all prerequisites are properly installed.
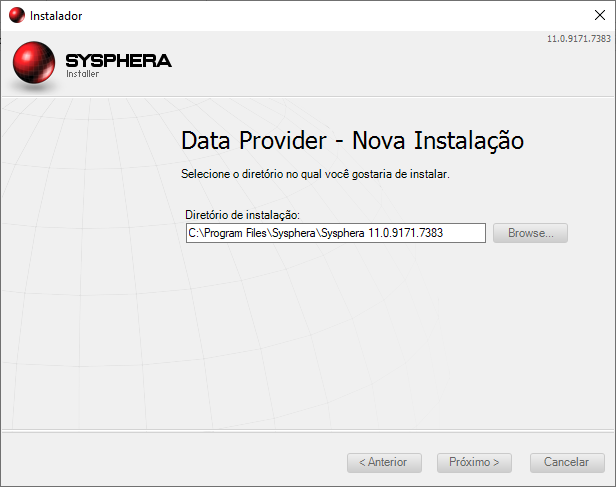
In the Data Provider - New Installation screen, select the directory where SDP will be installed and proceed to the next screen.
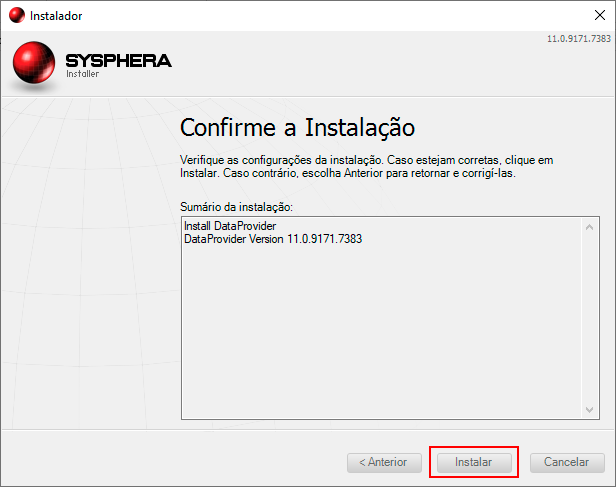
In the Confirm Installation screen, review the installation summary. If everything is correct, click Install. If you want to modify any parameters, click Back.
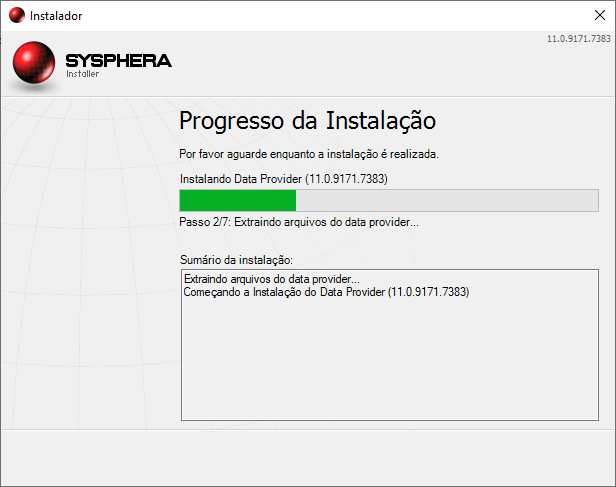
In the Installation Progress screen, you will track the entire installation progress.
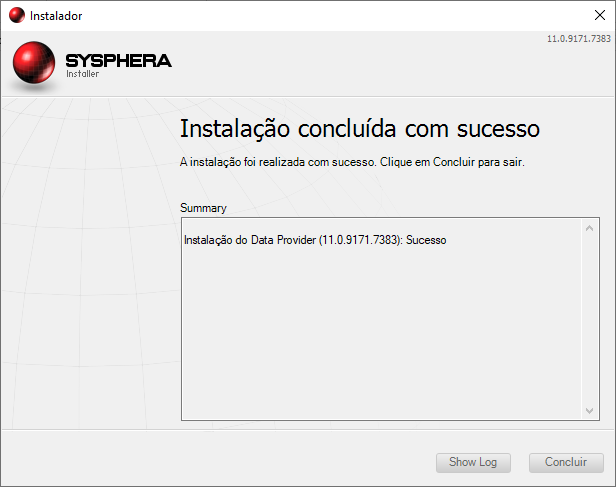
On the last screen, click Finish to close the installer.
¶ 6. T6 Planning Data Provider Update
¶ 6.1 Overview
In this chapter, we will cover the update of an already installed version of the T6 Planning Data Provider.
¶ 6.2 Extracting the Installer
Unzip the contents of the T6 Planning 11.1_xxxxxxx.zip file into a folder of your choice, where a folder called T6 Planning will be created automatically. Open this folder and locate the Installer.exe file. Double-click on it to start the T6 Planning update.
¶ 6.3 Running the SDP Installation
Before starting the T6 Planning update, it's important to note that it can only be performed by a user with Administrator access to the operating system.
The T6 Planning installer supports three installation languages: Portuguese, English, and Spanish. The installation language will be automatically set by the installer based on the user's operating system language.
When you run the installer, you will see a brief description of T6 Planning on the initial screen. To proceed with the installation, click the Next button.
The next screen will display the available Installation Types.
Select the Update Previous Installation option and proceed to the next screen.
The following screen will display the License Agreement. Read the license terms carefully and proceed to the next screen.
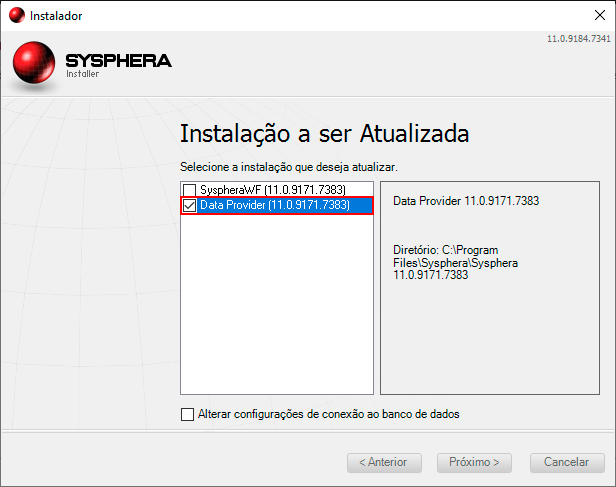
In the Installation to be updated screen, a list of installed T6 Planning products on the computer is presented, with a summary of each installation. Select one or more installations to be updated.
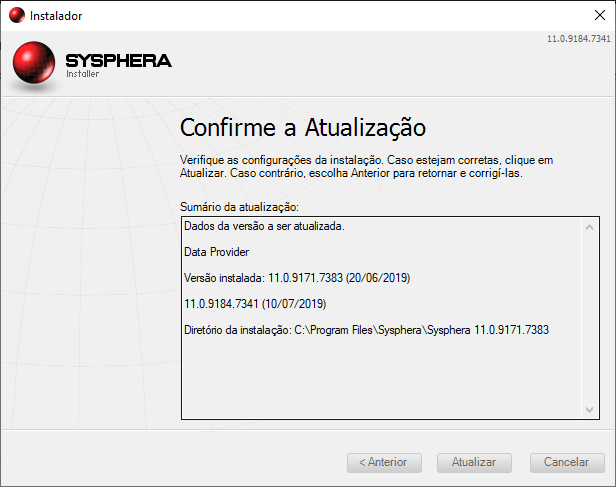
In the Confirm Update screen, review the update summary and click Update. If everything is correct, click Update. If you want to modify any parameters, click Back.
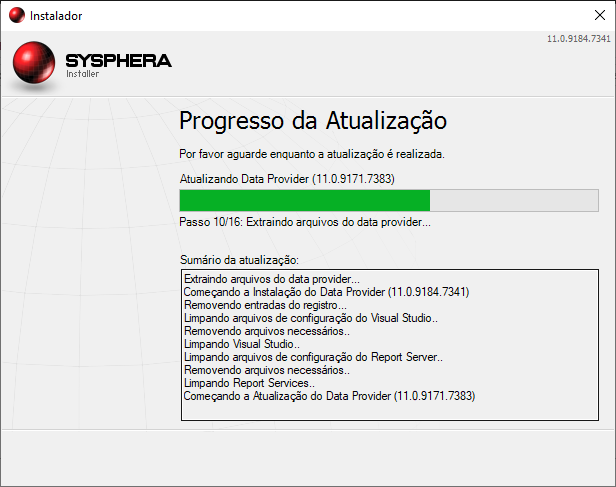
In the Update Progress screen, you will track the entire update progress.
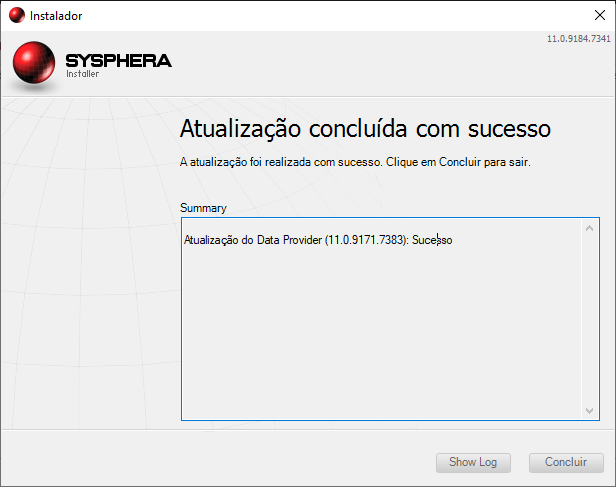
On the final screen, the summary will display information about the update. Click Finish to close the installer.
¶ 7. Uninstalling T6 Planning Data Provider
¶ 7.1 Overview
This chapter will show how to uninstall the T6 Planning Data Provider, which is done through the installer itself.
¶ 7.2 Extracting the Installer
Unzip the contents of the T6 Planning 11.1_xxxxxxx.zip file into a folder of your choice, where a folder called T6 Planning will be created automatically. Open this folder and locate the Installer.exe file. Double-click on it to run the installer.
¶ 7.3 Uninstalling T6 Planning
Before running the T6 Planning installer, it's important to note that uninstallation can only be performed by a user with Administrator access to the operating system.
The T6 Planning installer supports three display languages: Portuguese, English, and Spanish. The display language will be automatically set by the installer based on the user's operating system language.
When you run the installer, you will see a brief description of T6 Planning on the initial screen. To proceed with the installation, click the Next button.
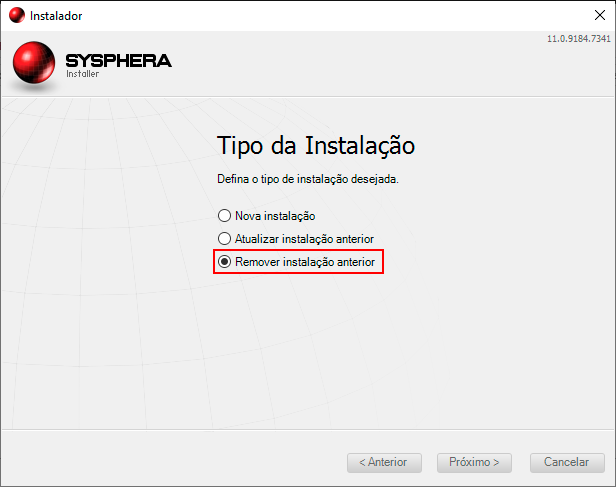
The next screen will display the available Installation Types. Select the Remove Previous Installation option and proceed to the next screen.
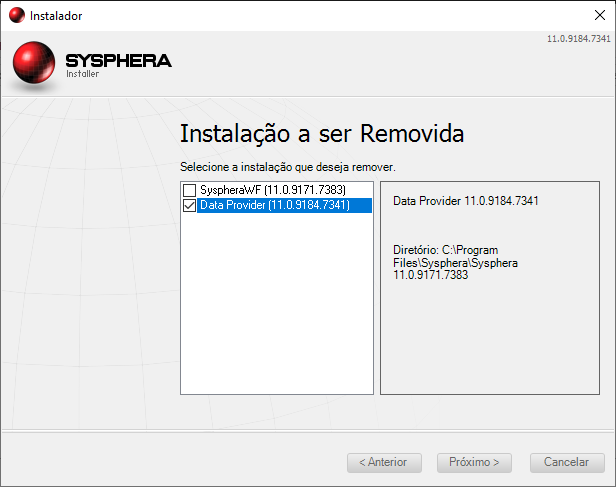
In the Installation to be removed screen, a list of installed T6 Planning products on the computer is presented, with a summary of each installation. Click on the installation to be removed. It will be selected. Then click the Next button.
It's important to note that only the application directory and its IIS portal will be removed, and the database will not undergo changes.
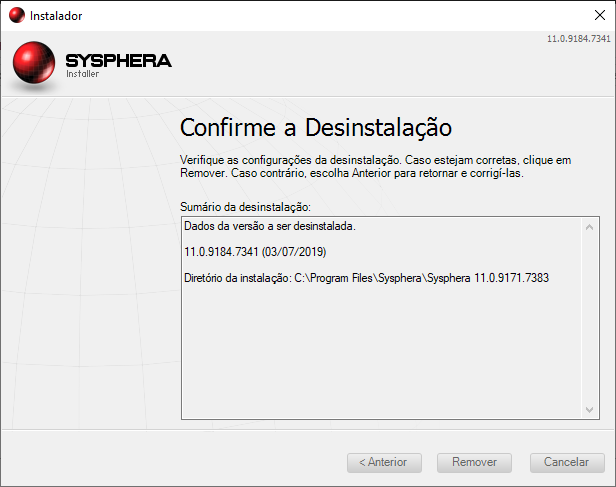
In the Confirm Uninstall screen, check the items to be uninstalled and click Remove.
In the Uninstall Progress screen, you can track the progress of the uninstallation.
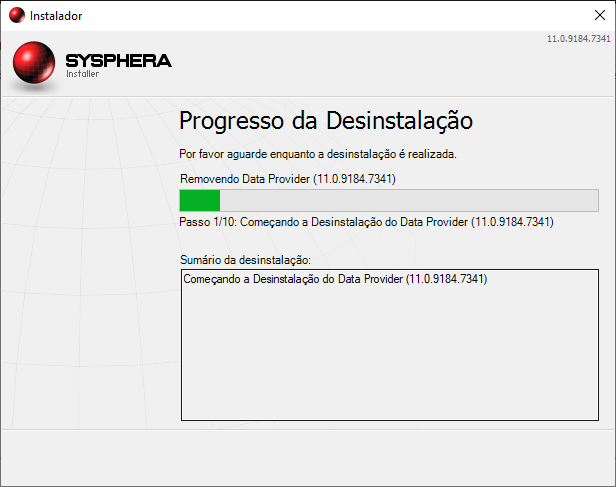
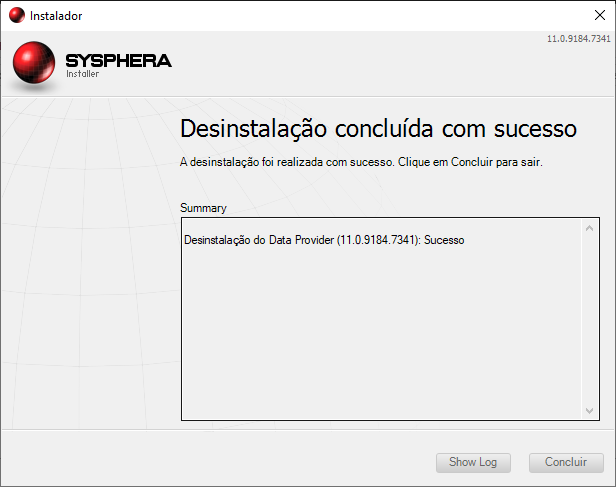
On the final screen, the summary will indicate that the uninstallation was successful. Click Finish to close the installer.
¶ 8. Getting to Know the Tool
¶ 8.1 Overview
This chapter aims to present, in a simple and concise manner, the use of the SQL Server Data Tools (SSDT) for creating reports and connecting to the T6 Planning database.
SSDT is a development interface that utilizes a version of Microsoft Visual Studio, providing tools for creating specific Business Intelligence projects. Among these projects is the creation of reports.
In this tool, you can create reports with data extracted from various sources, including:
- T6 Planning Model: Extracted through the T6 Planning Data Provider interface, these are data related to the business model developed in T6 Planning.
- T6 Planning Analytics Tables: Extracted through queries in the DataMart database generated by T6 Planning.
- Legacy Systems: Extracted through queries to legacy systems or other databases, using Visual Studio 2008 for BIDS and Visual Studio 2010 or higher for SSDT.
¶ 8.1.1 To Execute
- Access the Windows Start Menu and find the Visual Studio 2017 (SSDT) item.
¶ 8.1.2 To Open a Project
- Click on the project link that appears on the SSDT entry screen with the name Recent Projects, or through the menu File > Open Project.
- After navigating to where the project is located, select the file
<YourProject>.slnand click Open.
The image below shows the basic report development screen within SSDT. This interface is where reports are developed. The presented image is just an example, as the tool is configurable according to the user's needs, and the right and left windows can be hidden or closed and later reopened.
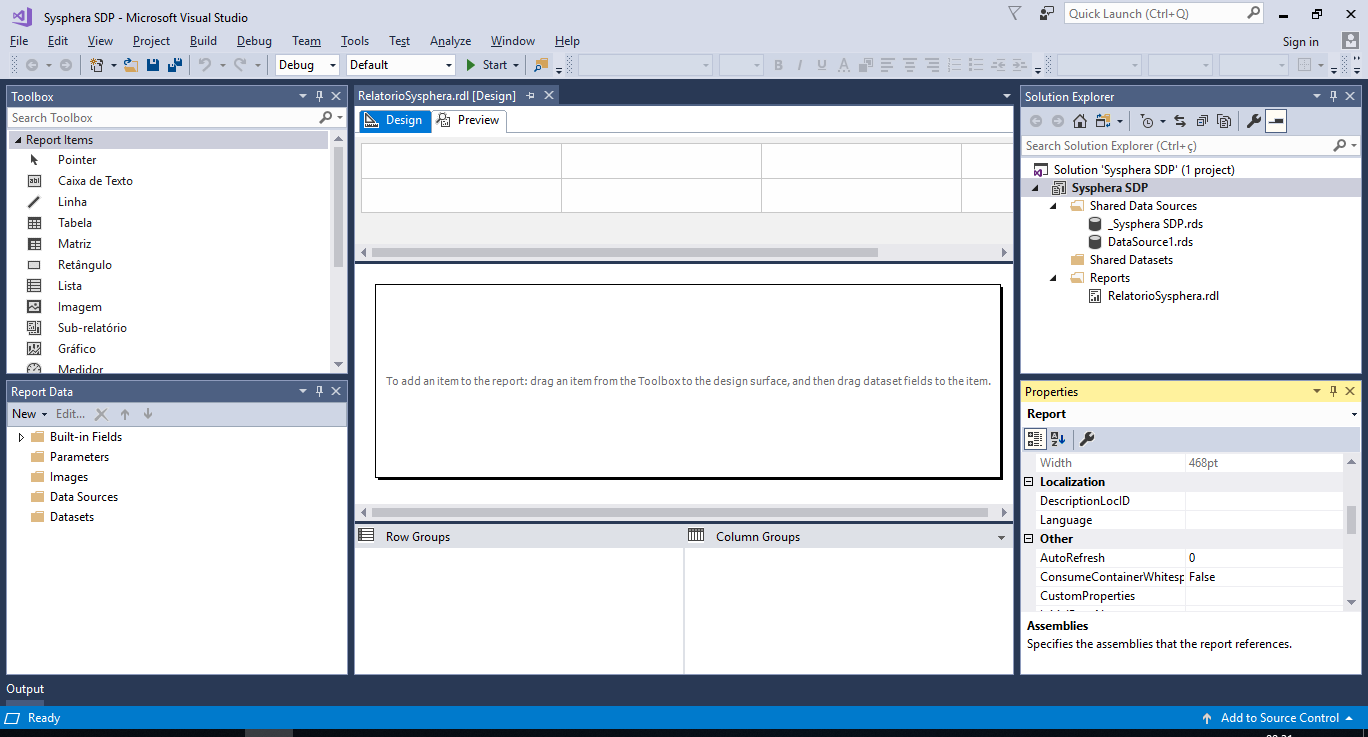
Check the descriptions of the identified items in the image above:
- Toolbox: a window that displays graphical components that can be used in the report design, such as text fields, tables, matrices, charts, and more.
- Report Data: a window with the available data structure, varying according to the number of queries in the report.
- Solution Explorer: a window with the objects of the entire project. Here, you can see Data Sources (which are data sources) and all the reports that are part of the project.
- Properties: in this window, you can configure all the properties of graphical components to meet your needs.
- Design: this tab is where all the configuration of graphical components is done. It is also where the connection between data and design is made.
- Preview: the ability to preview how the report is shaping up more easily before publishing it in T6 Planning.
- Layout Window: shows an example of configuring the design of a report.
¶ 8.2 Creating a Report Server Project
- On the SSDT home screen, click the File menu, and then click New > Project.
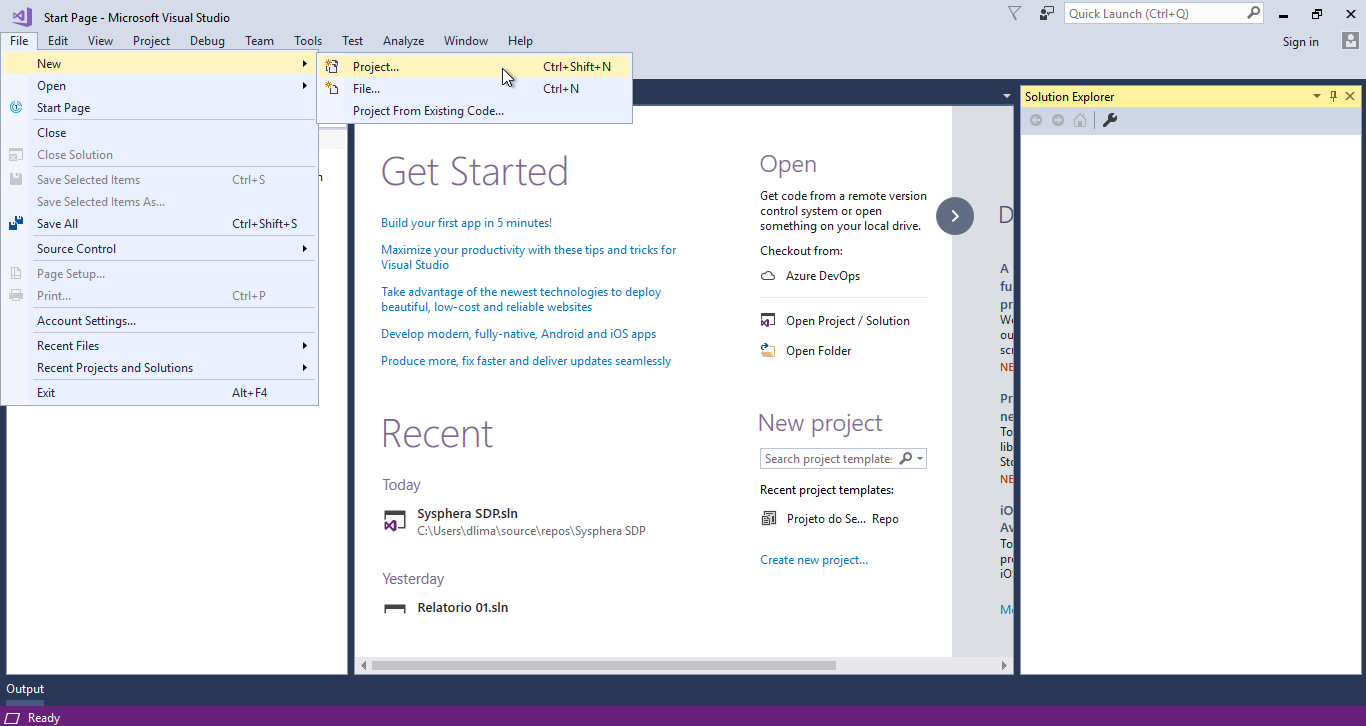
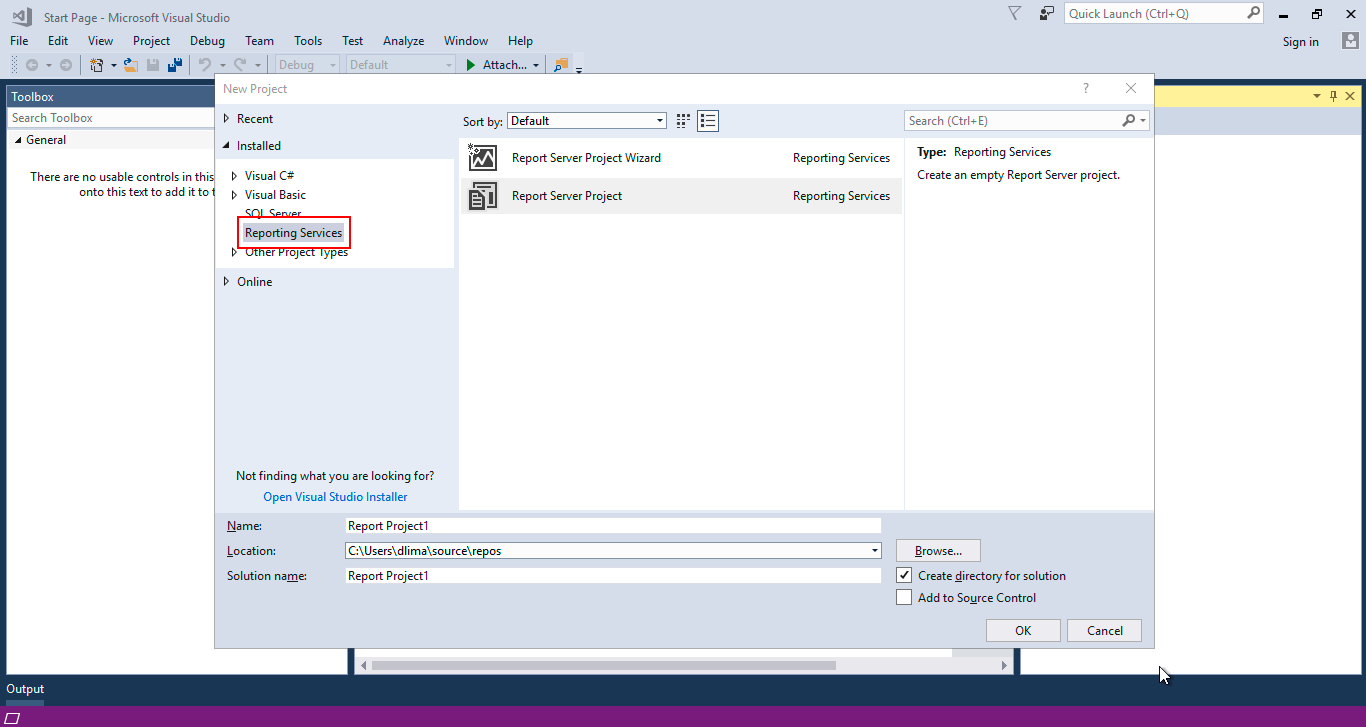
In the New Project screen:
- Select the Reporting Services template.
- Choose Report Server Project.
- Fill in the fields for the project to be created and click OK.
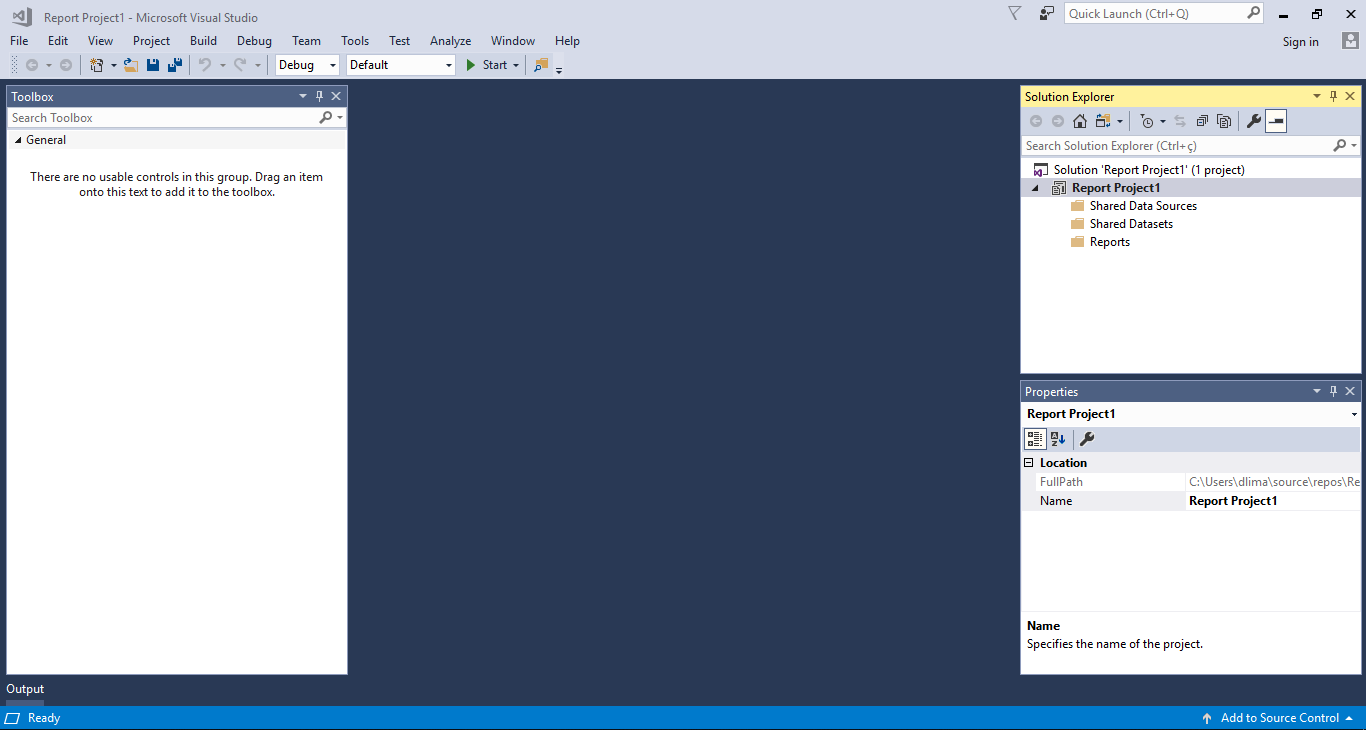
You have just created a Report Server Project, and from now on, the use of SDP is possible. The image below illustrates the initial screen of SSDT where you can access the new project.
¶ 8.3 Creating a Connection with T6 Planning
Before starting the development of reports accessing the T6 Planning interface, it is necessary to configure a new connection through SDP.
To create a new connection, follow the steps below.
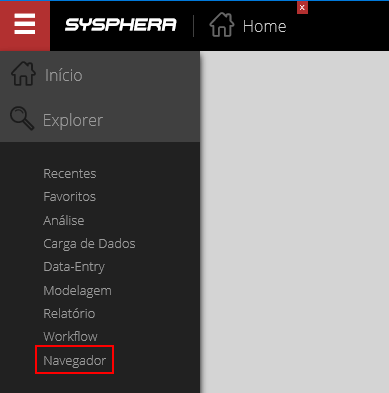
Access the T6 Planning menu and click on Explorer > Navigator.
In the Explorer screen, on the Integration tab, click on the Data Source item.
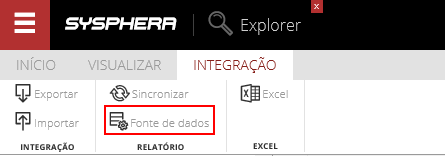
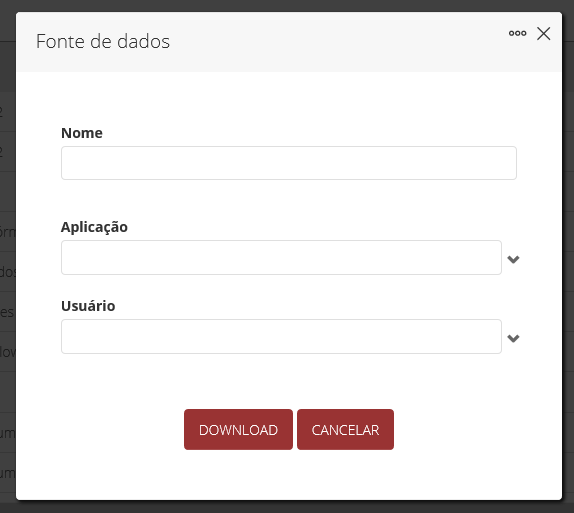
The Data Source window will be displayed. Fill in the fields Name, select the Application, and the User.
Then click the Download button to save the new Data Source.
Once the download is complete, return to SSDT, in the created project.
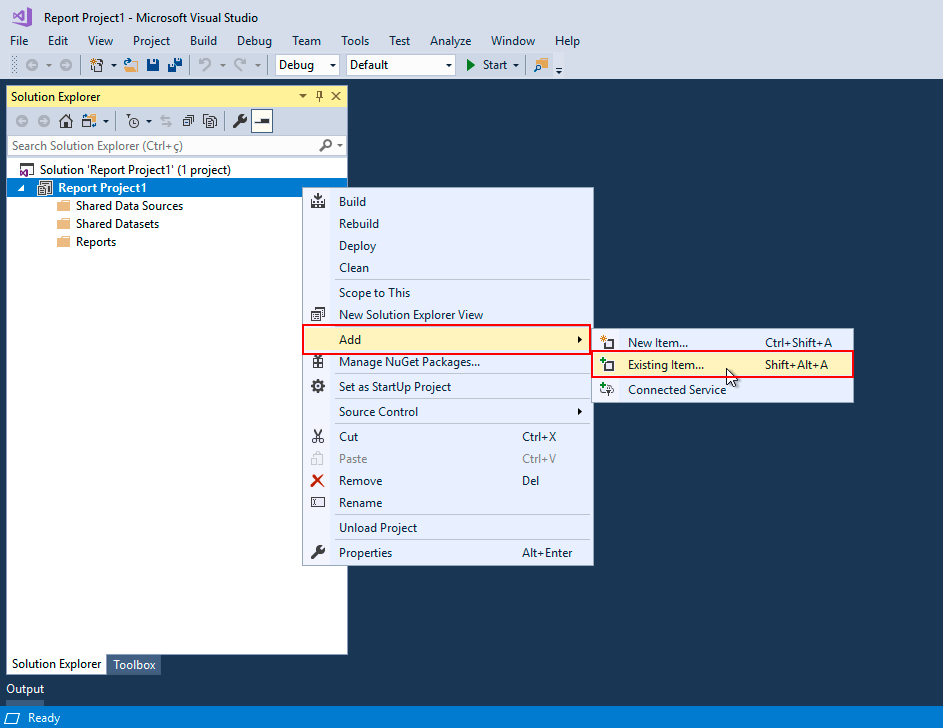
- In the Solution Explorer, right-click on the Project name and then access the menu Add > Existing Item.
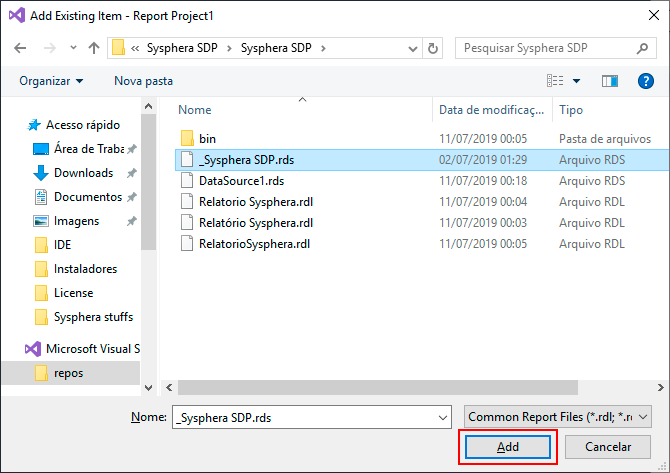
Next, find the previously created Data Source file and click Add.
¶ 8.4 Creating a Report
In this section, a step-by-step guide on how to develop a basic type of report will be presented.
Next, observe the exemplification of report creation using the Report Creation Wizard of the SSDT tool.
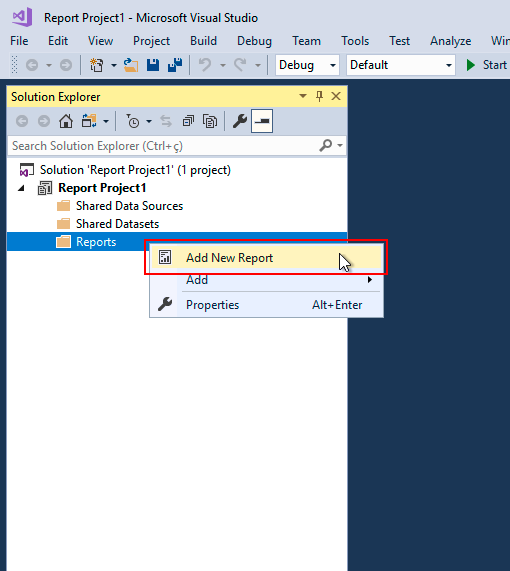
In the Solution Explorer:
- Right-click on the Reports folder in the Solution Explorer.
- From the opened menu, choose the Add New Report option.
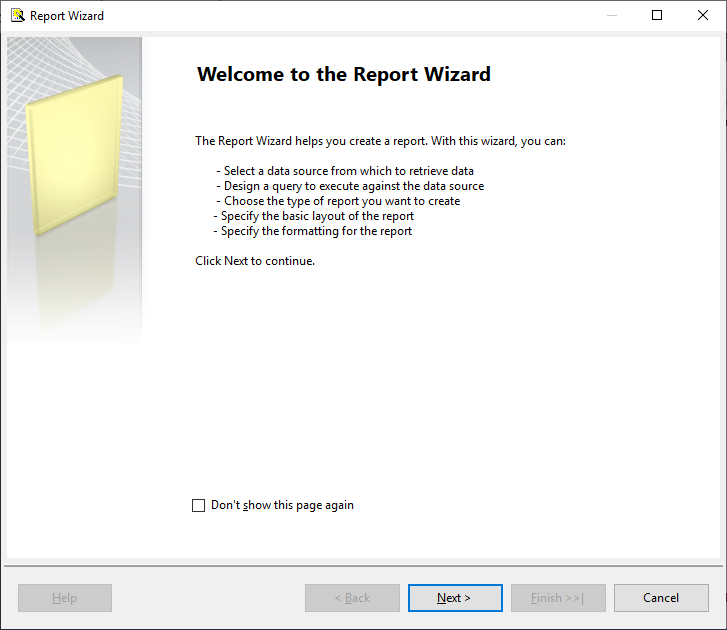
- The Report Creation Wizard will be opened.
On the Welcome screen (if displayed), click Next.
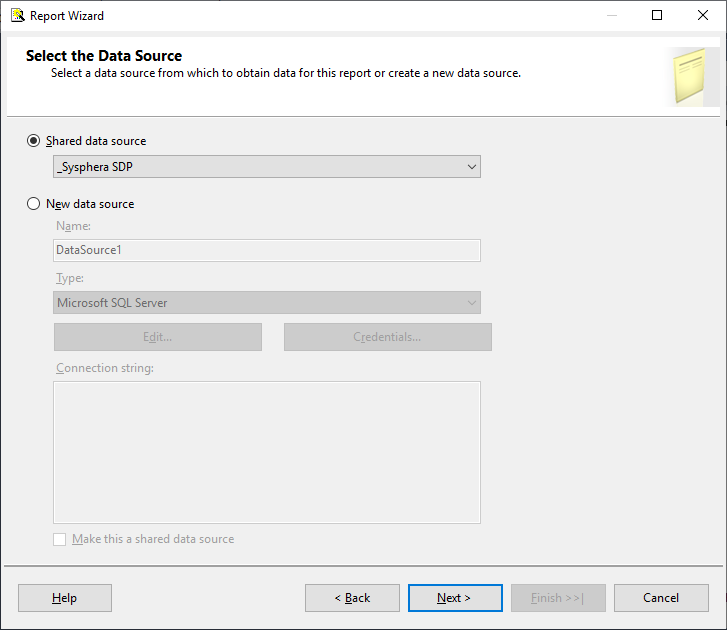
On the Select the Data Source screen:
- Select the Shared Data Source option and choose the T6 Planning connection you want to use. Then click Next.
Note: From this step onwards, you will begin the creation of the query that will bring the data for the report. This is the moment when the actual use of SDP begins.
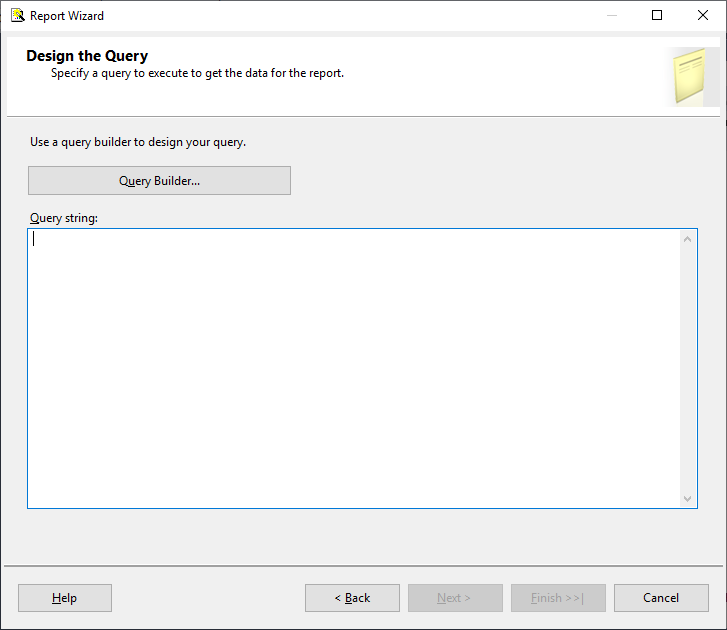
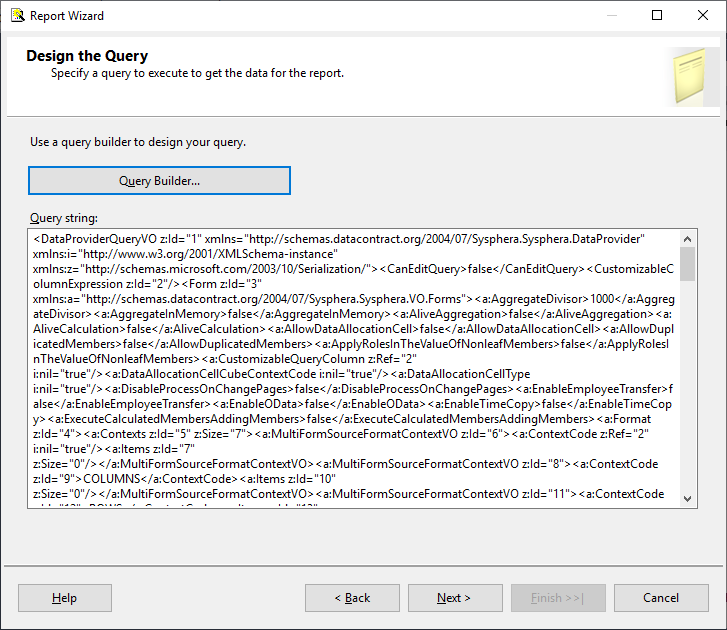
On the Design the Query screen:
- Click the Query Builder button. The Query Designer screen with the SDP interface will be displayed.
On the Query Designer screen: you will define the properties of the query in each of the steps of the SDP interface. Follow the details of the features in the 10 tabs of the Query Designer screen.
-
Tab Properties: Define and configure the properties related to the Query Type, Members, Query Options, as detailed below.
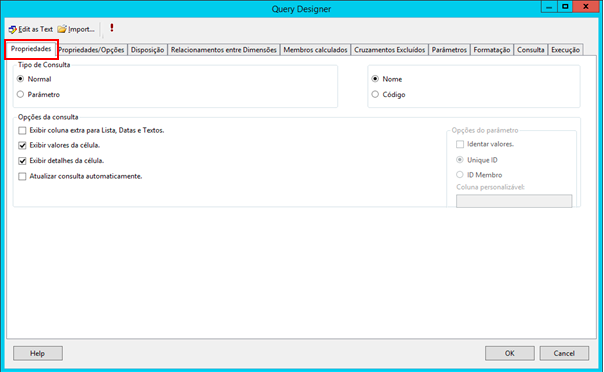
Regarding the property groups on this screen:
- Query Type: Used to define how the data structure (Dataset) will be created, i.e., how the field names of the dataset will be generated. There are the following options:
- Normal: Fields have the name of the dimension, plus a counter.
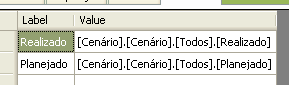
- Parameter: A specific type for defining items that will compose a dynamic list of values for parameters. It always has two columns: Label and Value.
- Normal: Fields have the name of the dimension, plus a counter.
- Name and Code: For advanced users who want to analyze the query created by SDP. It allows selecting whether the query will be created with the name or code of the members.
- Query Options: Allows configuring the query with one or more of the following options:
- Display extra column with textual value for Lists, Dates, and Texts: Displays an extra column containing values for List, Date, or Text type accounts.
- Display cell details: Displays an extra column containing cell details.
- Display cell values: Displays the value detail rows that make up the total cell value.
- Update Query Automatically: Allows the query to be updated automatically.
- Query Type: Used to define how the data structure (Dataset) will be created, i.e., how the field names of the dataset will be generated. There are the following options:
-
Tab Properties / Options
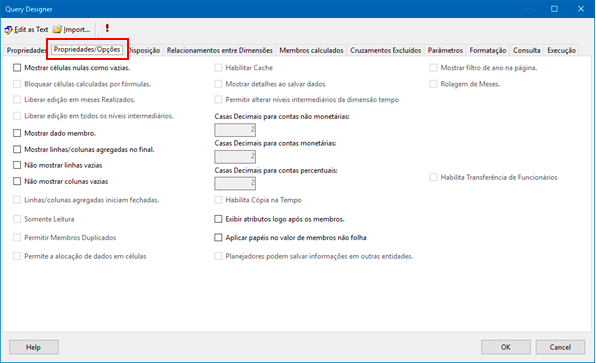
- Show null cells as empty: Shows cells without content as empty instead of displaying the value "0.00".
- Lock cells calculated by formulas.
- Enable editing in Realized months.
- Enable editing at all intermediate levels.
- Show Data Member: Shows data members in the result.
- Show aggregated Rows/Columns at the end: Shows total lines below the hierarchy of members that make up its value.
- Do not Show empty Rows or Columns: Allows the query to bring only the rows or columns that have a value, hiding null or empty rows or columns from the result.
- Show aggregated Rows/Columns start closed: Check this option to show the total lines/columns initially closed.
- Read-only: Check this option to make the form read-only, not allowing edits.
- Allow Duplicate Members: Check this option to review the same member in multiple positions.
- Allows data allocation in cells: Allows data allocation in cells.
- Enable Cache: Check this option to enable the cache on the first form execution, so subsequent executions of the same form will take less time.
- Show details when saving data: Check this option to view details when saving a form. These details can be Formula Execution, Updating Data, etc.
- Allow changing intermediate levels of time dimension: Check this option to allow editing intermediate members of the time dimension. Examples of intermediate members may be: Semesters, Quarters.
- Decimal Places for non-monetary accounts: Enter the total decimal places for non-monetary accounts.
- Decimal Places for monetary accounts: Enter the total decimal places for monetary accounts.
- Decimal Places for percentage accounts: Enter the total decimal places for percentage accounts.
- Enable Employee Transfer: Check this option to allow the transfer of employees between entities.
- Show attributes immediately after members: Check this option to display characteristics applicable to dimension members in the form.
- Apply roles to non-leaf member value: Allows entering values at intermediate levels, allocating the value to leaf members.
- Planners can save information in other entities: Check this option to allow other Planners/Data Reporters, in addition to the one defined in the entity, to enter data into the form.
- Enable as a data source: Allows saving the form as a Data Set (a data source) on the Reporting Server for use in SDP.
- Enable pages as a data source: Allows saving pages as a Data Set (a data source) on the Reporting Server for use in SDP.
- Show year filter on the page: Check this option to show a year filter on the pages.
- Months Rolling: Check this option to show time starting in the chosen month defined by the time dimension on the page (Filter). Only months from the chosen month on the page to the selected number for rolling will be displayed.
- Enable Employee Transfer: Check this option to allow the transfer of employees between entities.
-
Tab Layout: Define "what you want" and "how you want" in your query, configuring the necessary fields as detailed below. After finishing the configurations, click Ok.
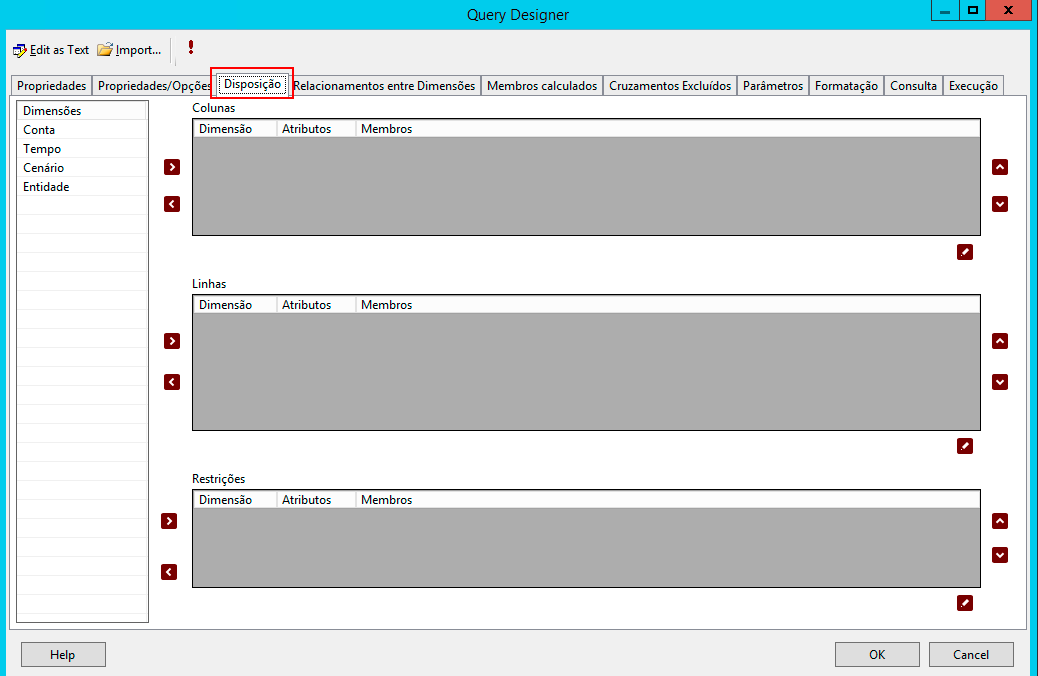
Regarding the information layout on the Layout tab:
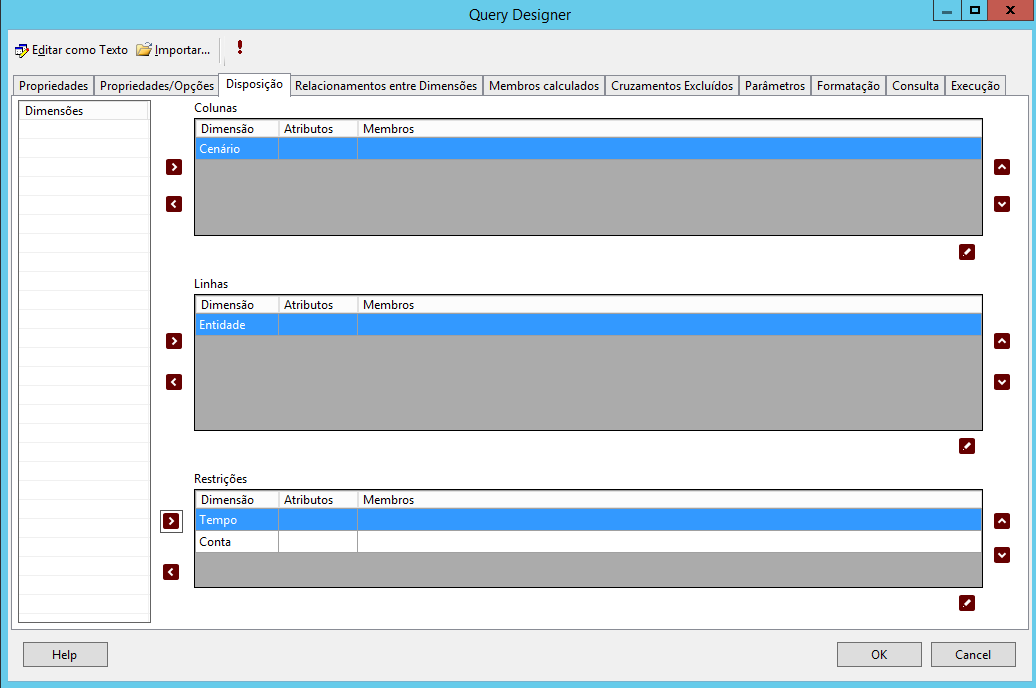
- On the left side of the tab, there are dimensions of the cube configured in the connection being used and calculated members of this report.
- On the right side of the tab, there are three axes where you can place the dimensions: Rows, Columns, and Constraints.
- In the central part of the tab, there are two buttons for each axis: one is used to add the selected dimension to the corresponding axis, and the other to remove it. You can also drag the dimensions to define their layout in the report.
- As you can see, this layout interface is very similar to that within T6 Planning for form creation.
Regarding the steps for configuring the fields on the Layout tab:
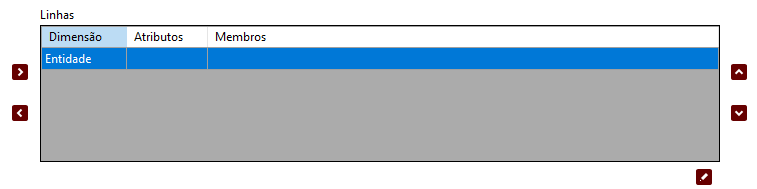
- Allocating dimensions: You can distribute dimensions on the three axes.
Rows and columns will contain the information to be displayed. The constraint axis will be used to fix dimensions in a single member, like a kind of filter. The selection and allocation of items are done using the arrow-indicated icon. - Defining dimension members: You will define which members of each dimension you want to present in your query. To do this:
- Click on the highlighted icon as shown in the image below.
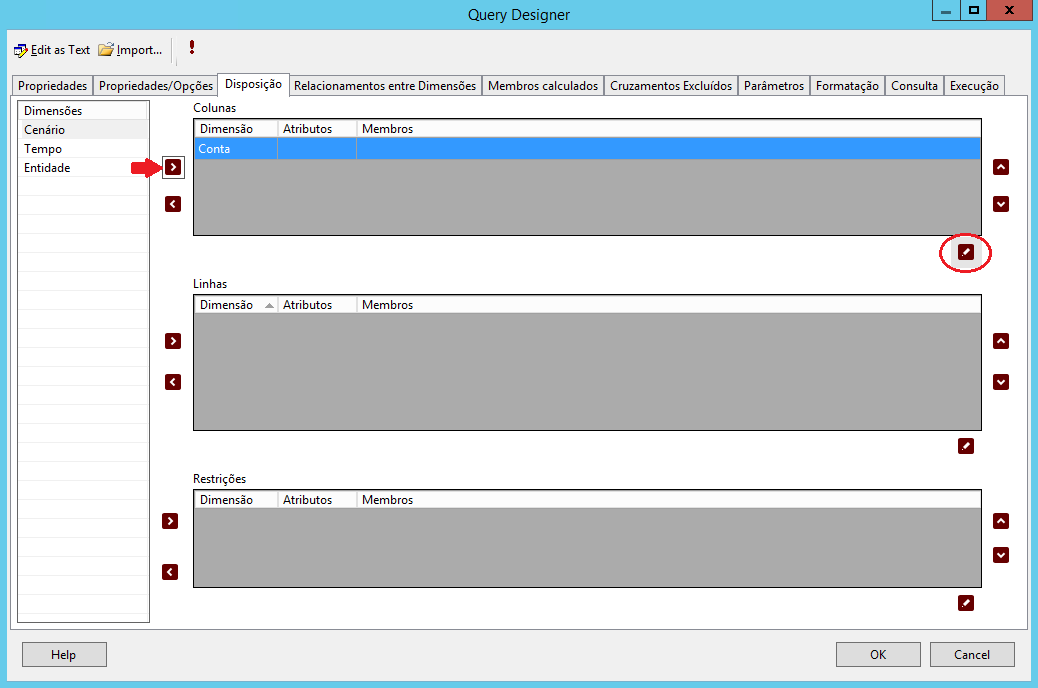
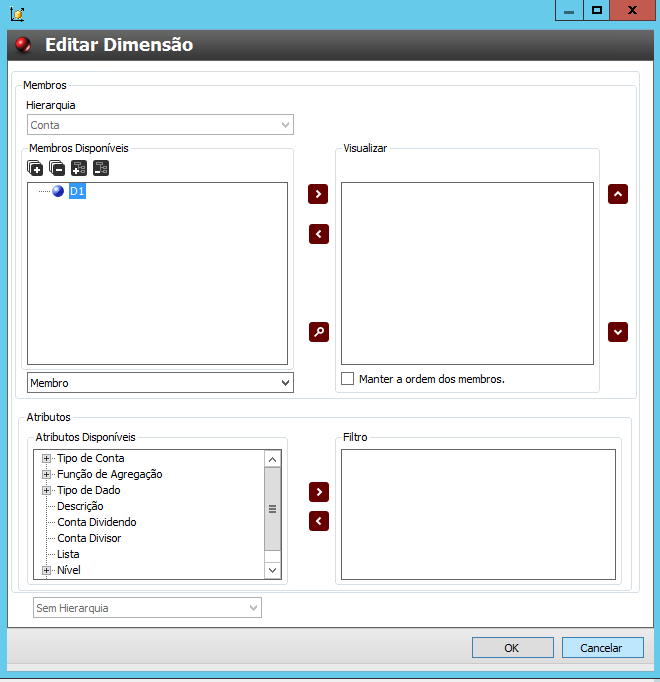
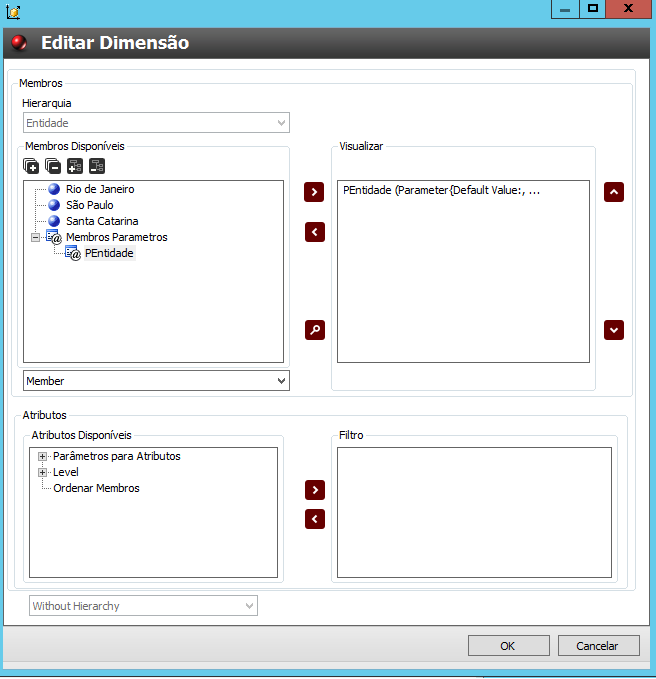
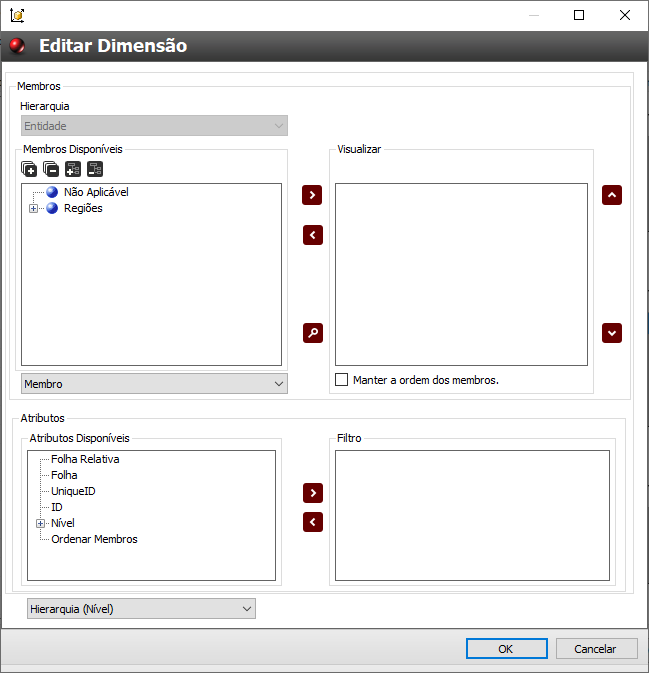
The Edit Dimension screen will be displayed, for the selection of members or attributes of the dimension.
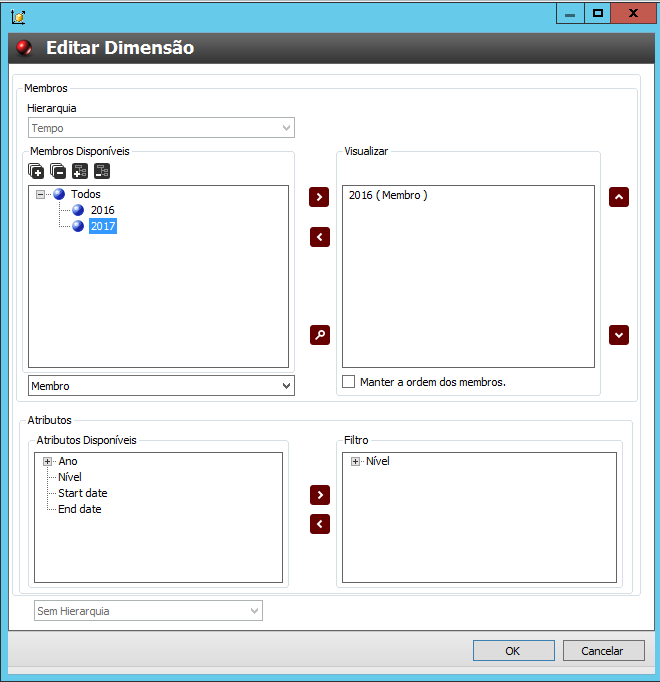
You should proceed in the same way for all dimensions, selecting only those members you want to see in the query result. If a dimension has no defined members, it means that all members of this dimension will be presented in the query.
After making the selections, click Ok.
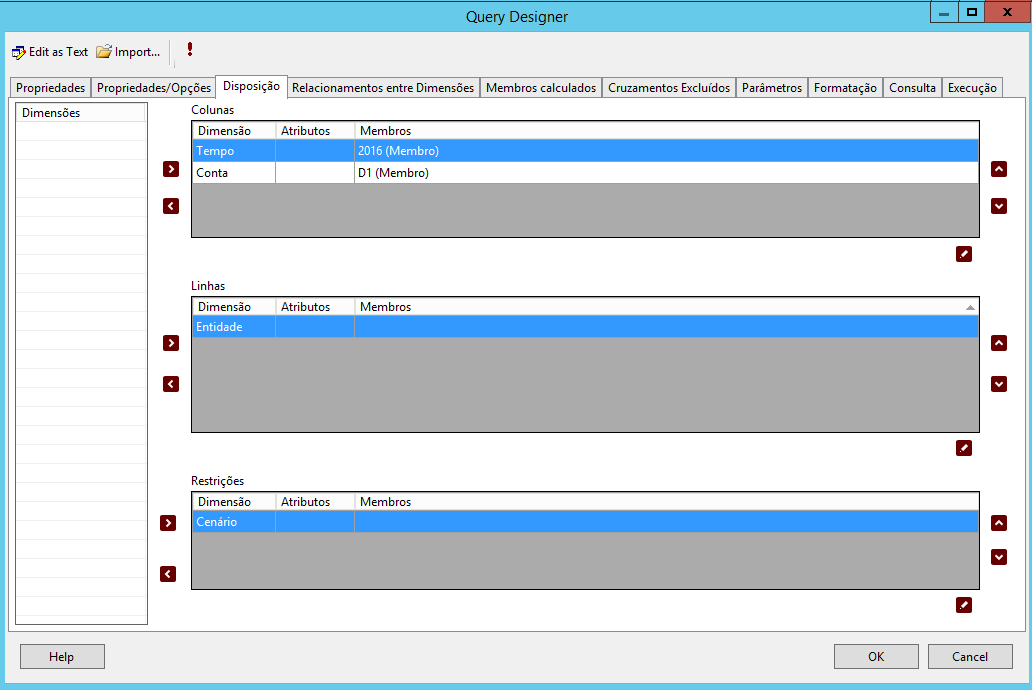
In the image on the side, observe how the Layout tab looks after completing the dimension configurations.
-
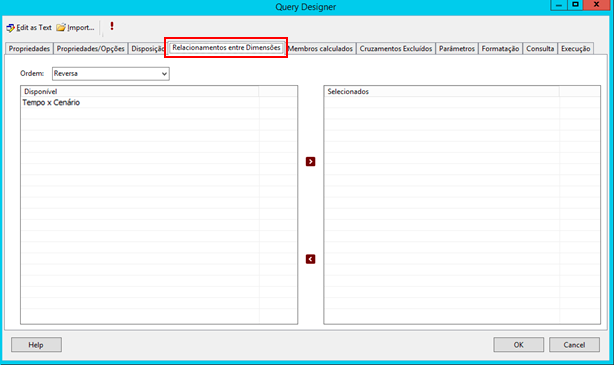
Tab Dimension Relationships: You can select the dimension relationships you want to use in the query.
Regarding the information layout on this tab:- On the left side, a list of available relationships is displayed.
- On the right side, a list of selected relationships is displayed.
- In the central part, there are two buttons that you can use to add or remove the selected relationships from the query.
-
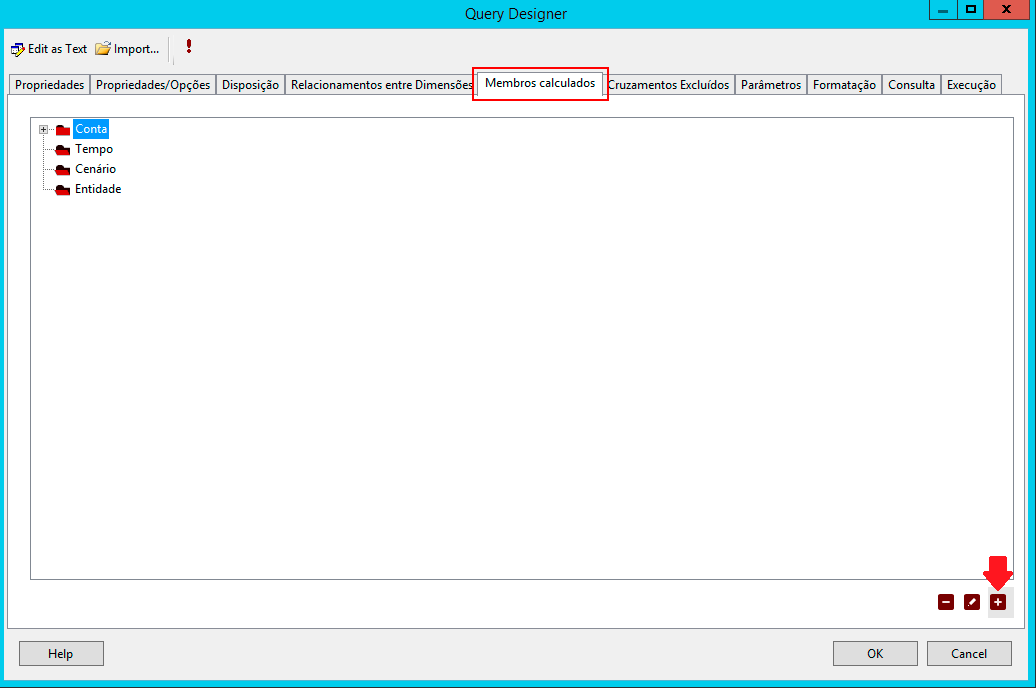
Tab Calculated Members: Allows the creation of simple calculations between members of dimensions without the need for formula creation.
- To add, click the button highlighted in the bottom right corner of the screen.
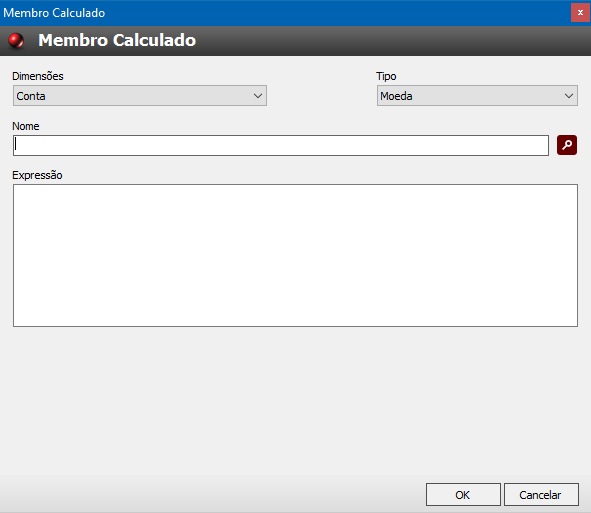
On the Calculated Member Creation/Editing screen:
- In the Dimensions field, select the dimension to be used for the creation/editing of the calculated member.
- In the Type field, choose between Currency, Percentage, Text.
- In the Name field, enter the name of the calculated member.
- In the Expression field, write the terms used to identify the next valid actions/operations for simple calculations between members of dimensions without the need for formula creation. You can also use the Ctrl+Space keys for terms to appear automatically.
-
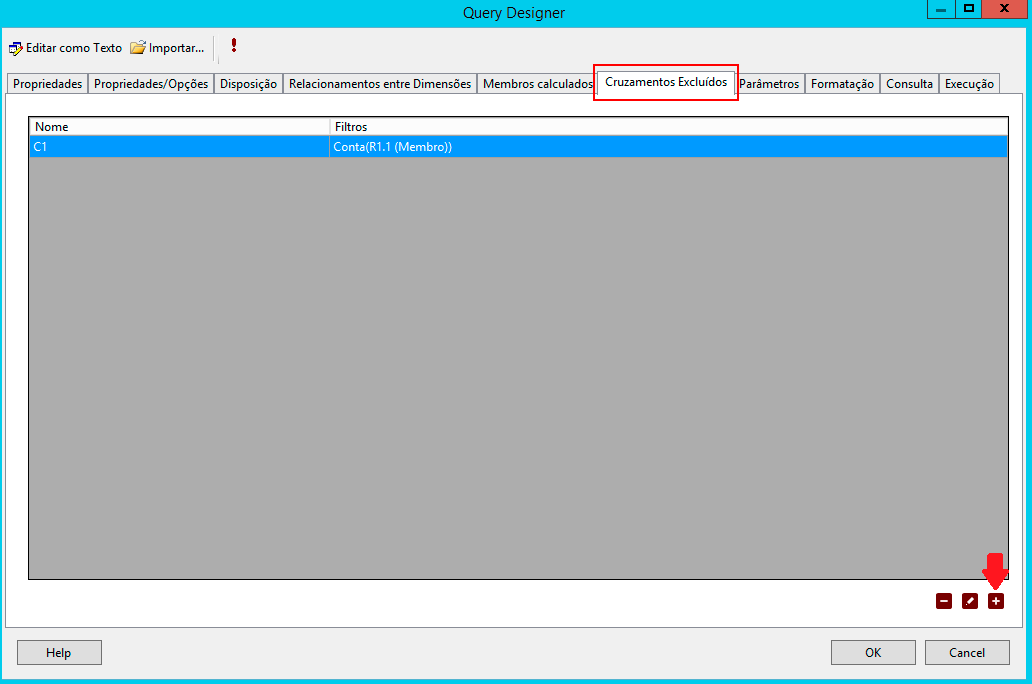
Tab Excluded Crossings: Allows the creation, editing, and removal of crossings/combinations between members and dimensions for simple calculations between members of dimensions.
- To add, click the button highlighted in the bottom right corner of the screen.
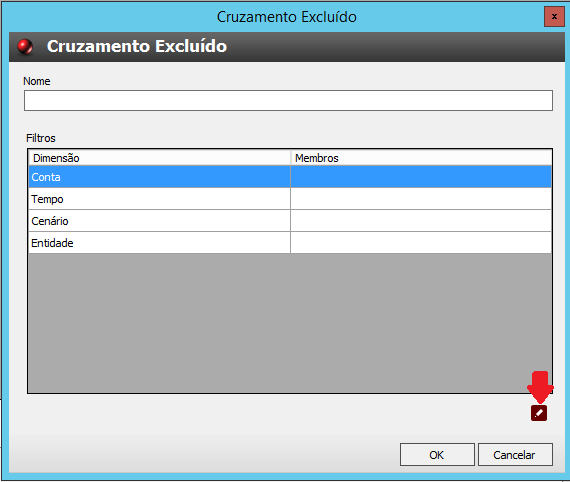
On the Excluded Crossing Creation/Editing screen:
- In the Name field, enter a name for the crossing.
- The Filters field displays the list of dimensions to choose from to add the crossing.
- Select the dimension to be used for the creation/editing, then by clicking the Edit button, it will be possible to select the members of the chosen dimension.
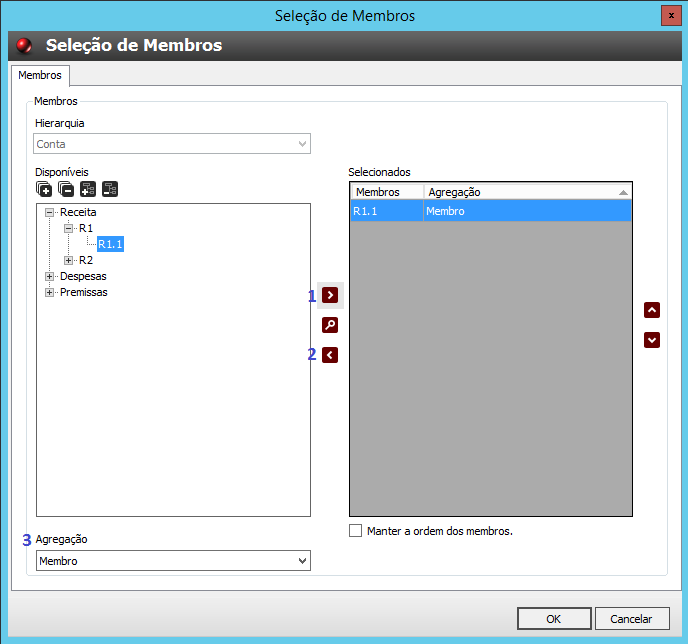
The Member Selection screen allows the selection of members with a specific aggregation, as well as their respective attributes, for the selected dimension.
- Click to add the member to the list of selected members.
- Click to remove the member from the list of selected members.
- Select the type of aggregation to be applied to the selected members.
After defining the member selection, click Ok, returning to the Excluded Crossing Creation and Editing screen. Click Ok again.
-
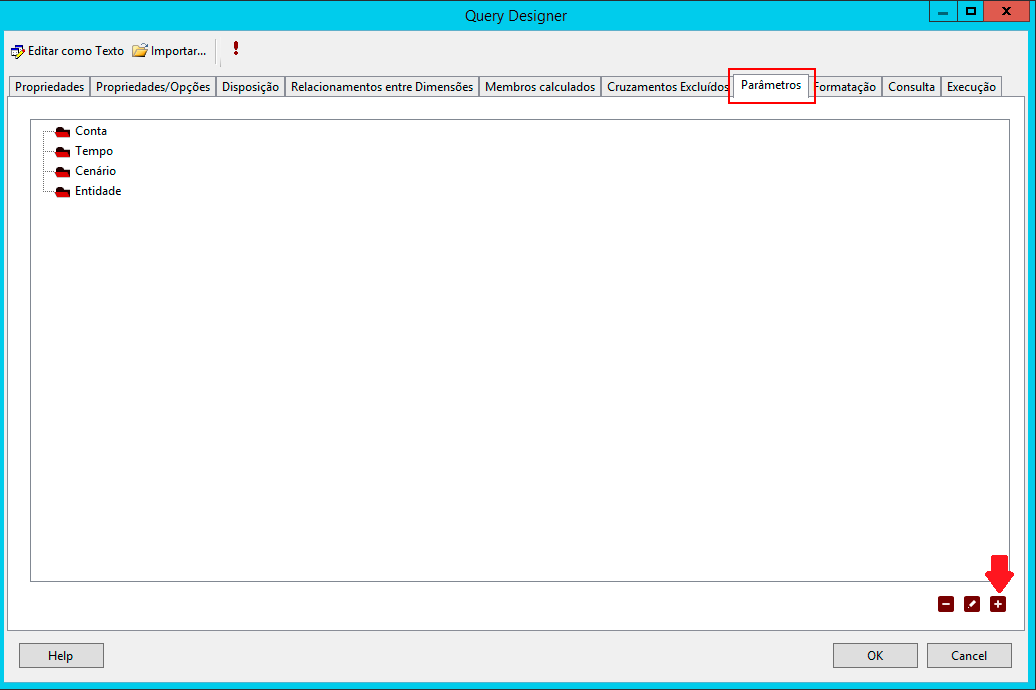
Tab Parameters: Allows more specific filtering of form dimension members, helping to narrow down its scope or allowing other views in a practical and intuitive way. This way, the user can change, for example, the base year or the planned scenario without having to edit the form, as these parameters can be used even in calculated members.
- To add, click the highlighted button in the bottom right corner of the screen.
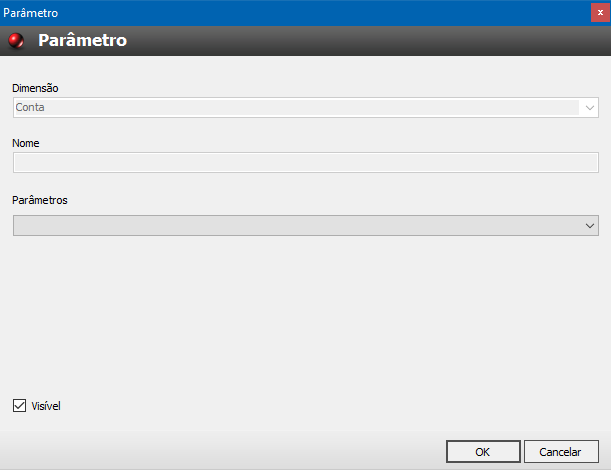
On the Parameters Creation/Editing screen:
- The Dimension field identifies in which dimension the parameter will be saved.
- In the Name field, enter the parameter name.
- In the Parameters field, choose the desired parameter from the list.
-
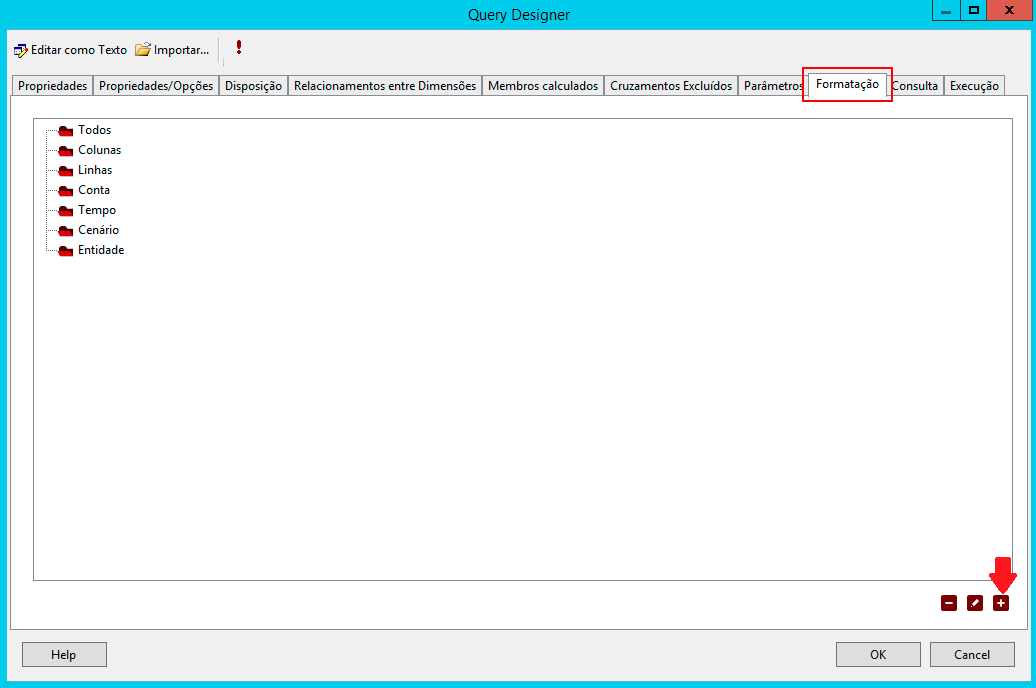
Tab Formatting: Allows formatting forms with changes in fill colors, font, background, and borders of Headers or values. It is also possible to direct these formatting options to all or some specific items such as rows, columns, Dimensions, or Members.
- To add, click the highlighted button in the bottom right corner of the screen.
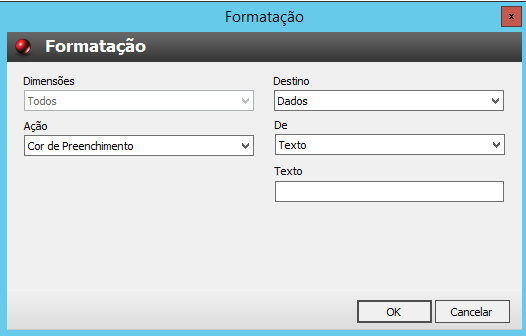
On the Formatting Creation/Editing screen:
- In the Action field, choose colors, font, size, and style.
- In the Target field, select whether the formatting will be applied to the header or data of the form.
- The "From" field determines if the formatting will be for the Data Table, Expression, Attribute, or Text.
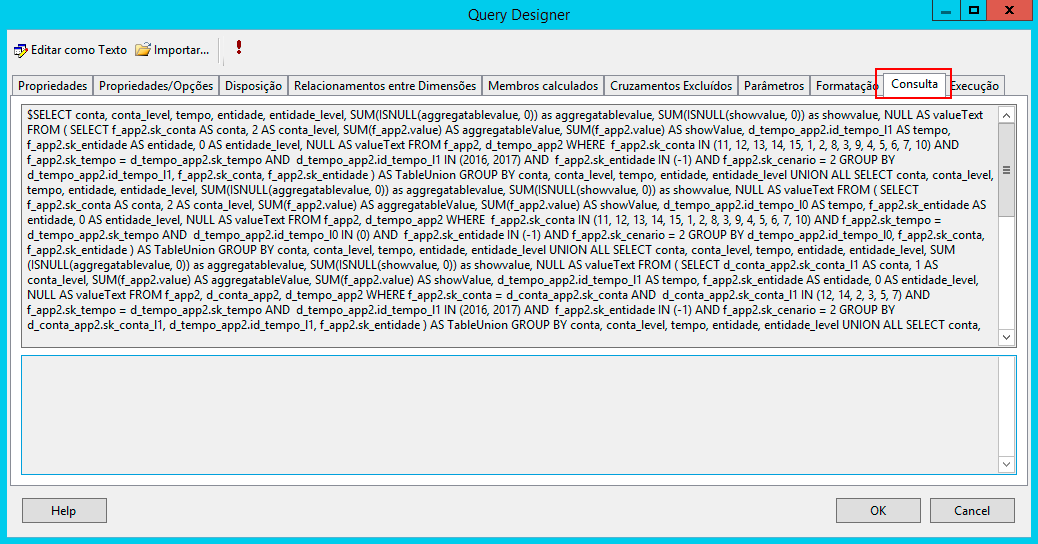
-
Tab Query: You will see the SQL query that T6 Planning uses for data extraction.
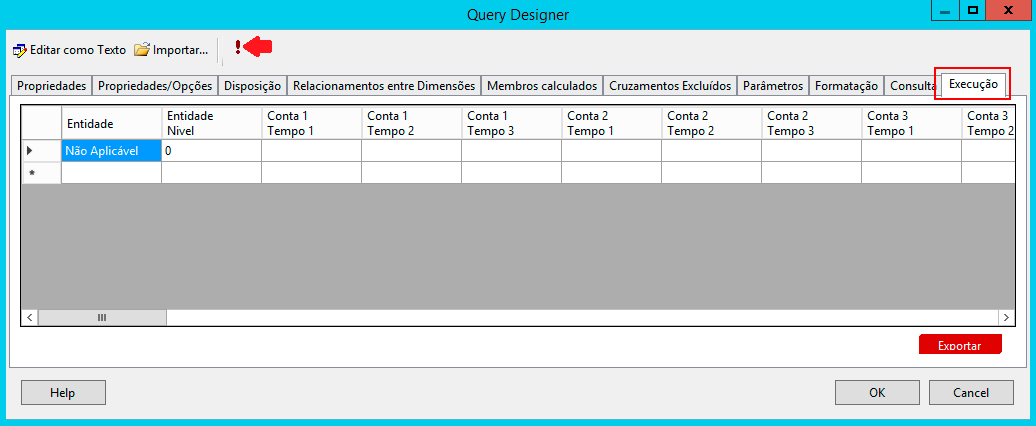
-
Tab Execution: Click on the highlighted icon as shown in the image below. You will see the result of the query as per the image.
Returning to the Query Designer screen. To finish defining the query in the SDP interface:
-
Click Ok. At this point, you will exit the SDP interface and return to the Report Design Wizard, the Design the Query screen.
On the Design the Query screen: -
Note that it now displays the code generated by the SDP.
-
To proceed, click Next.
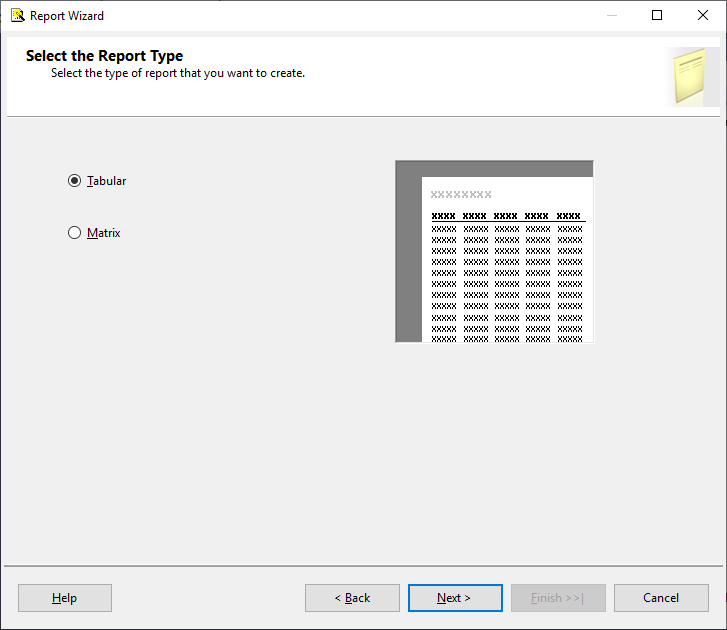
On the Select the Report Type screen: You will begin to define how the query data will be presented. To do this:
- Choose the Matrix or Table option. In this example, the Table option was selected.
- Then click Next.
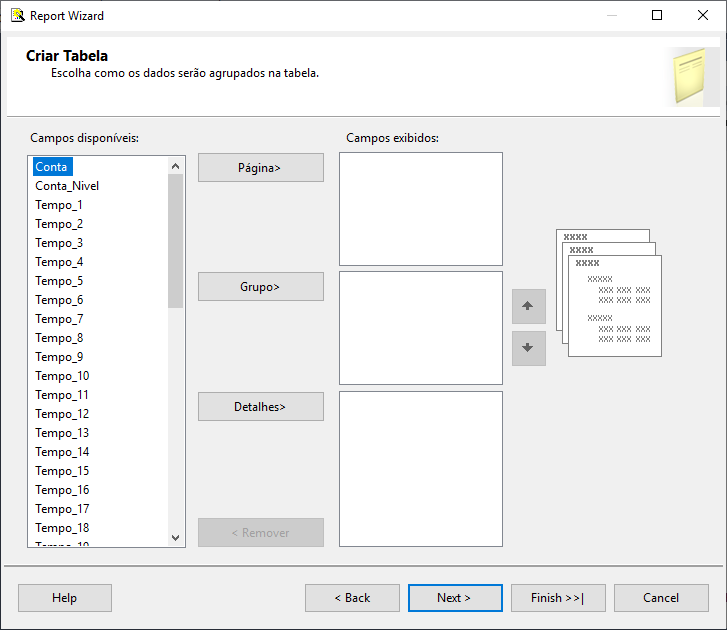
On the Create Table screen: The configuration depends on the option selected in the previous screen. Here you will distribute the query fields in the Table components, according to the adopted example. To do this:
- Place Time data in the Columns, Account data in the Rows, and the Value in the Details.
- After configuring, click Next.
Once the wizard is finished, SSDT will generate a basic report according to the settings defined in the previous steps.
¶ 8.4.1 Parameter connectionString
For reports created from SDP to function correctly, it is necessary to create a parameter called "connectionString." This parameter is internally used by T6 Planning to define permissions and apply roles during the execution of published reports.
Note: The name of this parameter must be "connectionString" (without quotes), with the initial "c" in lowercase and the "S" in "String" in uppercase.
To create the parameter, follow the steps below.
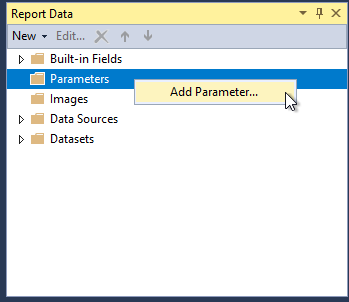
In Report Data:
- Right-click on Parameters and choose the option Add Parameter.
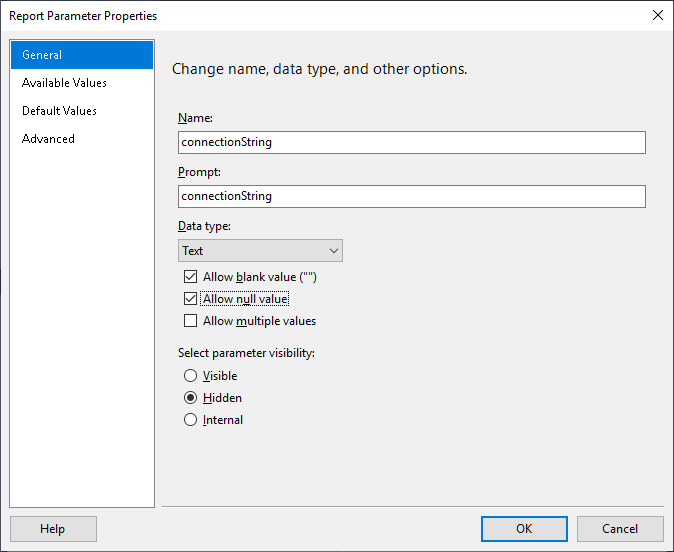
In the Report Parameter Properties screen:
- On the left side, click on General.
- In the Name and Prompt fields, type connectionString.
- In the Data Type field, select the Text type, then check the options Allow blank value (“”) and Allow null value.
- In the Select parameter visibility field, check the Hidden option.
- To finish creating the parameter, click Ok.
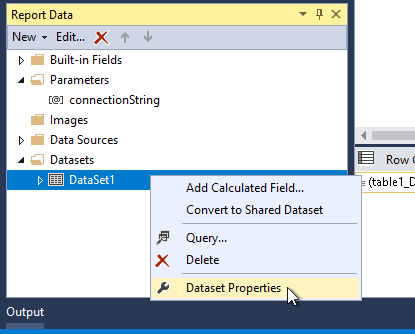
Back in Report Data:
- Right-click on the dataset to which you want to add the parameter.
- Then click on Dataset Properties.
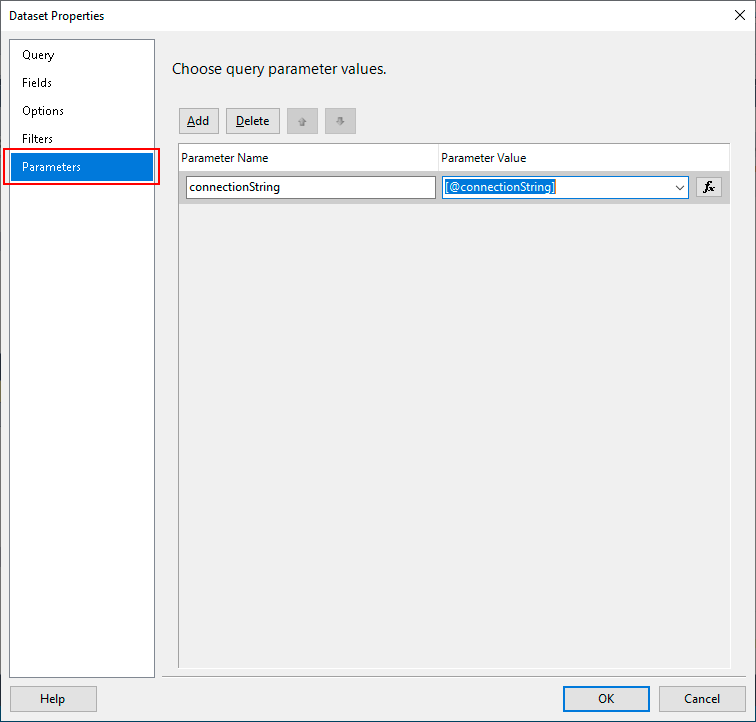
In the Dataset Properties screen:
- On the left side, click on Parameters.
- In the Parameter Name field, enter "connectionString."
- In the Parameter Value field, select the parameter
[@connectionString]. - To finish, click Ok.
¶ 8.4.2 Basic Formatting
Analyzing the design of the report created in the previous section, some configurations are still necessary to make it at least acceptable. In this section, you will be instructed on how to perform basic formatting to make your report more presentable.
¶ 8.4.2.1 Configuring Columns
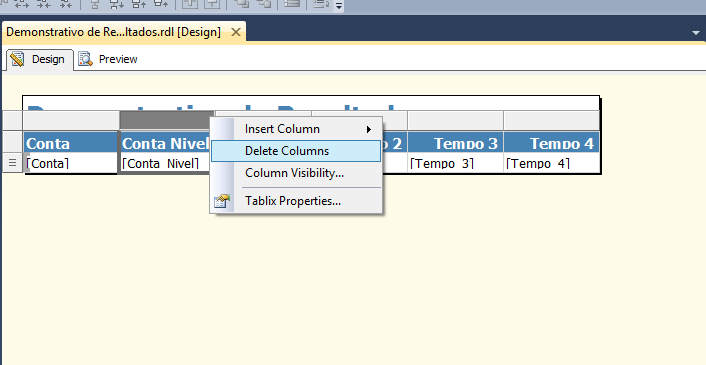
In the Report, on the Report Design screen:
To remove a column:
- Right-click on the header of the column you want to remove (in this example, Account Level).
- In the menu that opens, click on Delete Columns.
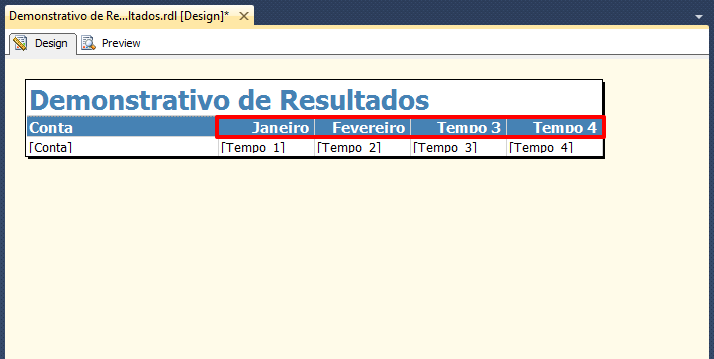
To change the text of a column:
- Double-click on the text and then type the new text.
¶ 8.4.2.2 Formatting Numbers
In the Report Design screen, to ensure the report numbers appear properly formatted, you need to define the Number property. This property will be applied only to the selected field and should be changed in all other fields as needed. To do this:
Select the Textbox to be formatted. In this example, the detail field of the matrix is used.
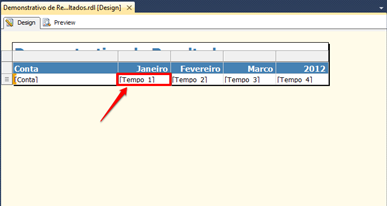
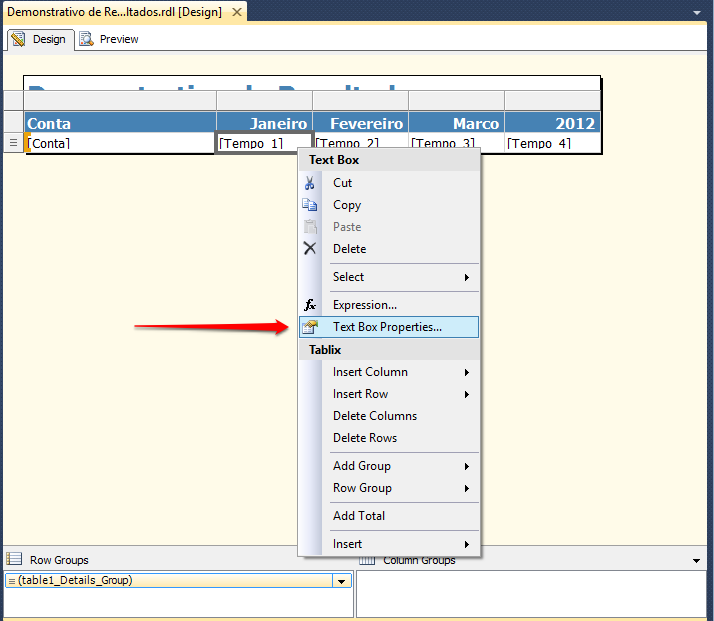
Then right-click on the textbox and select Text Box Properties.
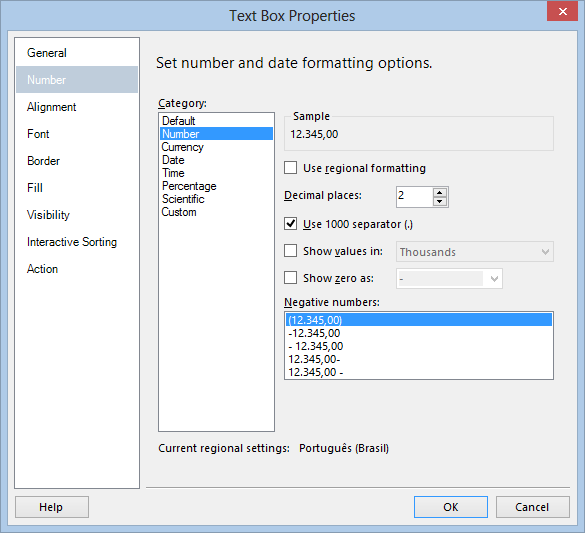
In the Text Box Properties screen:
- Click on the Number option. You can choose various properties, in addition to the format of the field itself. You can choose the separator character, the number of decimal places, time and date formats, etc.
- After configuring, click Ok.
¶ 8.4.2.3 Sorting Groups
By default, the groups of the table are sorted alphabetically. If you want to change the group sorting, follow the steps below.
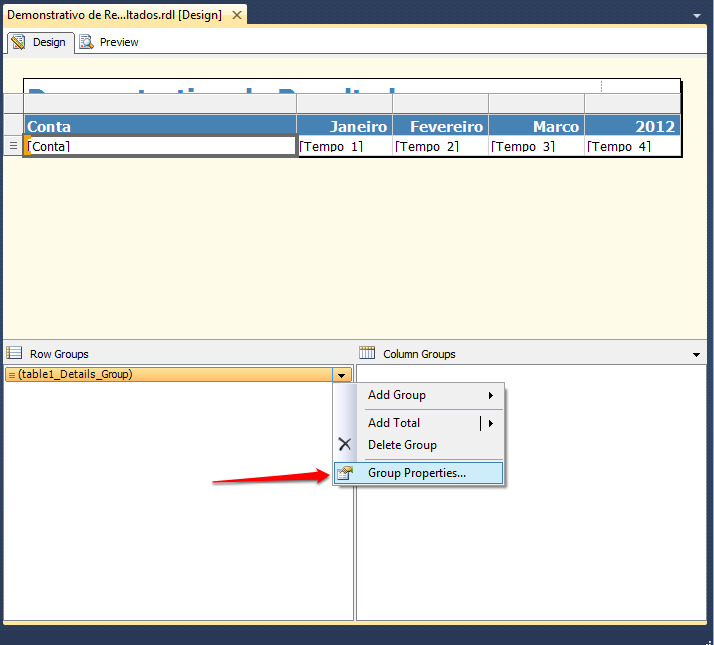
In the Report Design screen:
- Select the group to be formatted and right-click on the group name, then select Group Properties.
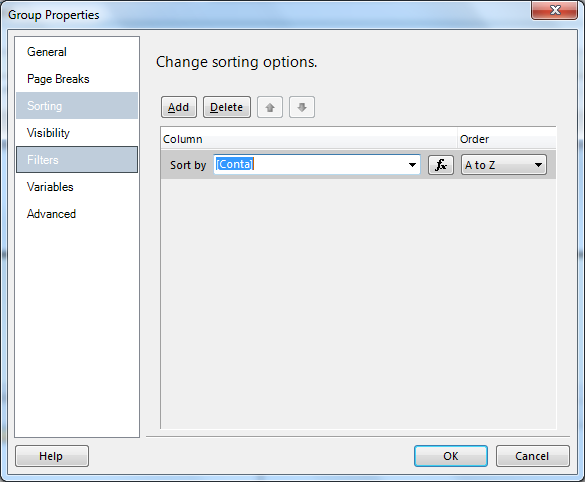
In the Group Properties screen:
- Click on Sorting. You can add or delete options in this menu using the Add and Delete buttons.
- In the Sort by field, enter the column you want to sort.
- After configuring, click Ok.
¶ 8.4.2.4 Changing the Expression
Another default configuration of the wizard that causes issues when using SDP is the use of the SUM function in the detail expression.
As in T6 Planning, each account has its aggregation method, a simple summation could generate incorrect results. For this reason, SDP already brings all possible combinations and aggregations, ready and calculated.
To proceed with the correction and prevent aggregation errors, follow these steps:
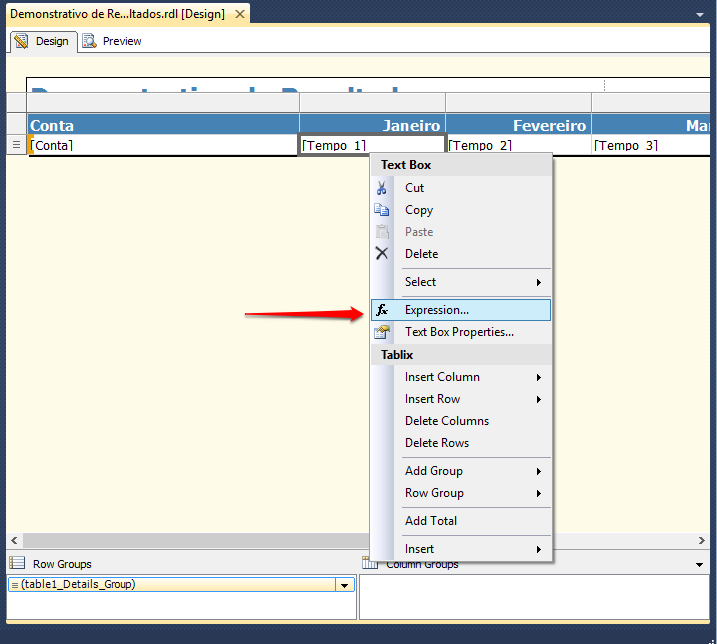
In the Report Design screen:
- Right-click on the detail textbox and select the Expression option.
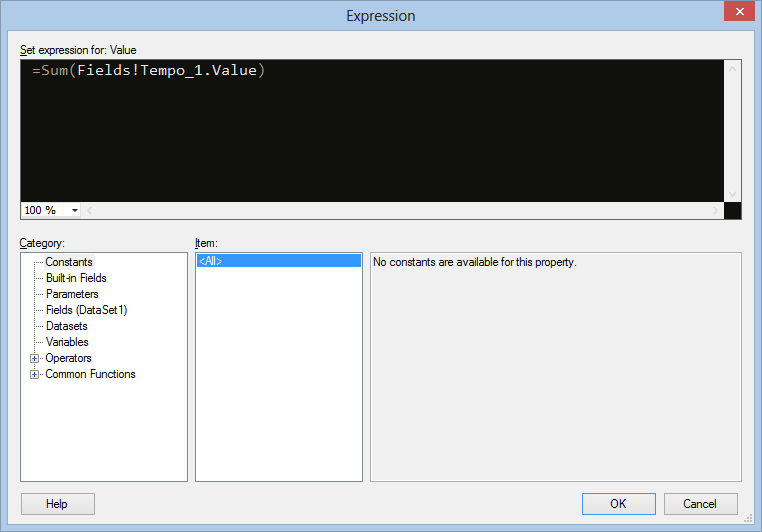
In the Expression screen:
- If the expression field contains the SUM function, delete this function and the parentheses, leaving only the value returned from the query. See examples in the following images.
- To finish, click Ok.
This Expression screen may appear in various other locations in SSDT. Almost all properties can be defined using conditional formulas, which depend on other fields or properties. This functionality is very useful as it allows extensive flexibility in configurations.
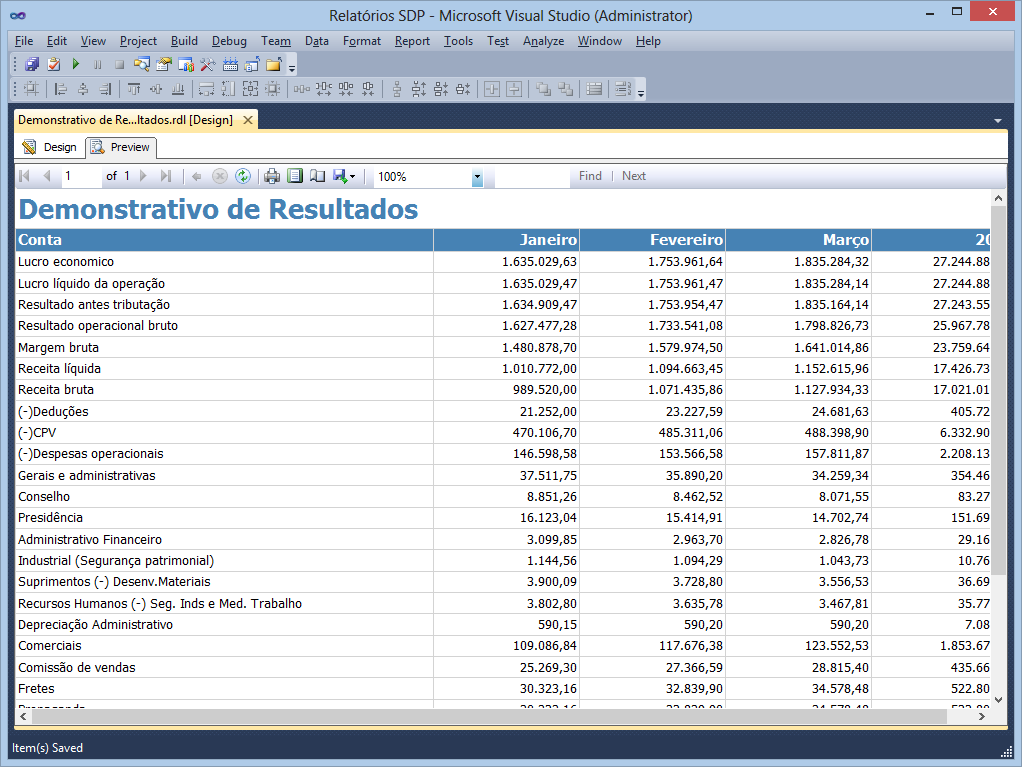
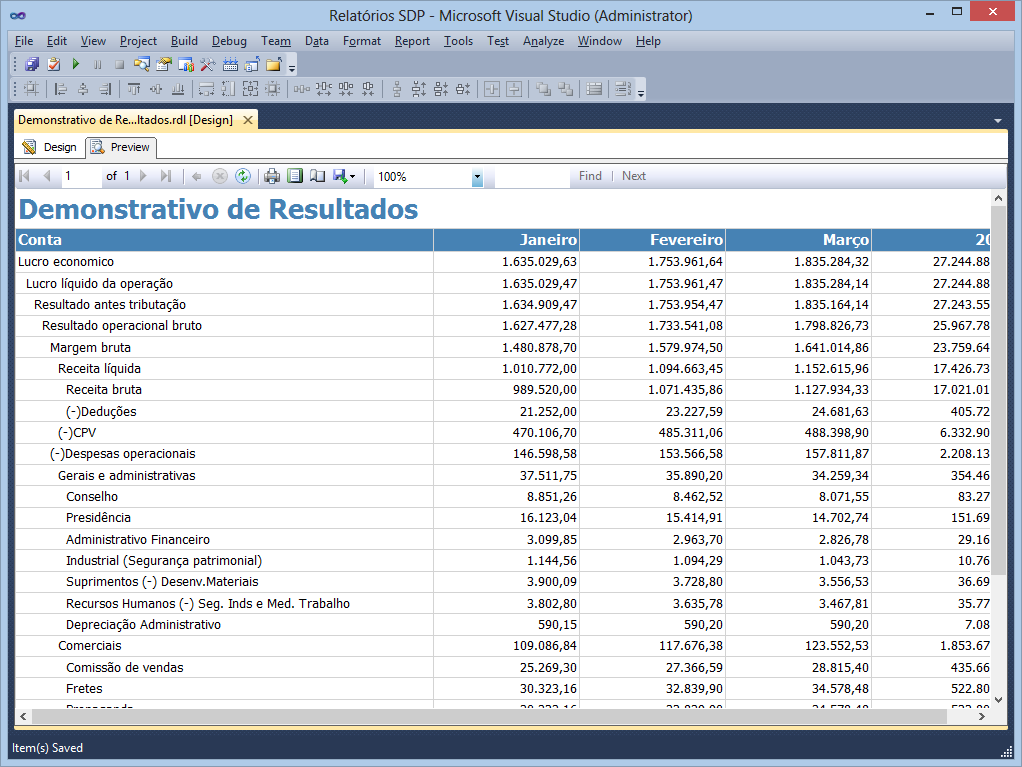
¶ 8.4.2.5 Displaying Rows Hierarchically
Another configuration that contributes to the visual presentation of the report is displaying the list of members hierarchically, according to their level in the T6 Planning dimension hierarchy. To proceed with this adjustment, follow these steps:
In the Report Design screen:
- Right-click on the column's textbox related to Account and select the Expression option.
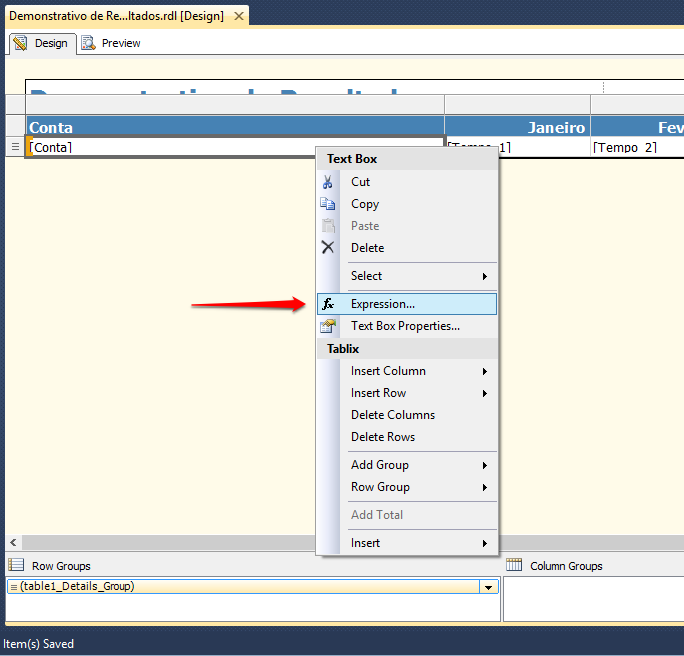
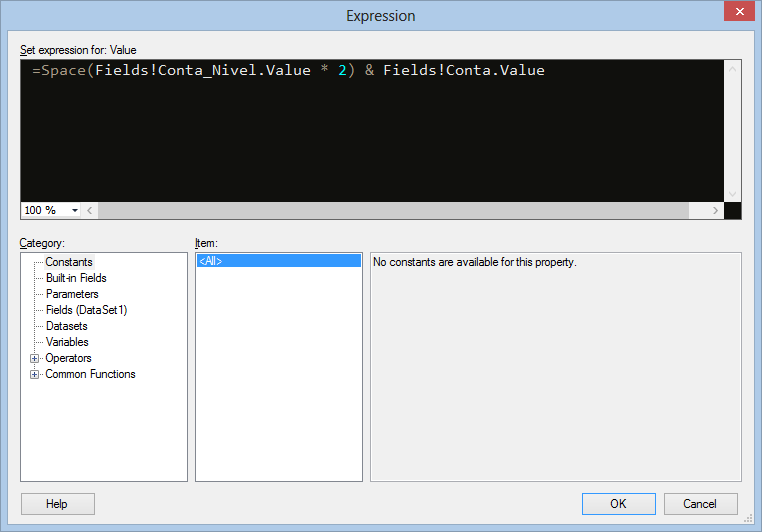
In the Expression screen:
-
Fill in the field with the following expression:
=Space(Fields!Conta_Nivel.Value * 2) & Fields!Conta.Value -
To finish, click Ok.
In the following images, observe the before and after of the report after this small modification.
¶ 8.5 Publishing a Report
¶ 8.5.1 Publishing the Project to T6 Planning
Now that the report is ready, it needs to be published on Report Services and then synchronized with T6 Planning.
¶ 8.5.1.1 Configuring the Publication
The first step to publish the project (with all the included reports) is to configure access to Report Services. To do this:
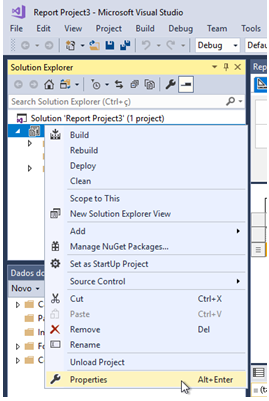
In the Solution Explorer:
- Right-click on the project name (the second line) in the Solution Explorer and select the Properties option.
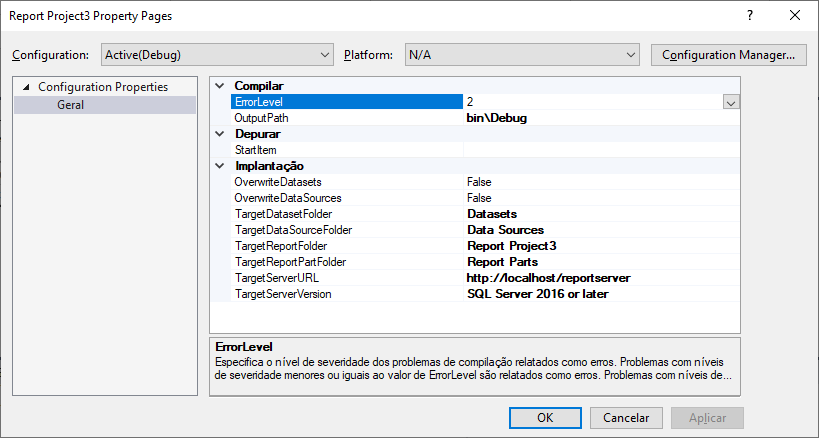
In the SDP Property Pages screen:
- Set the Reporting Services URL by entering the address in the TargetServerURL property. Normally, the address has the following structure:
http://<server>/ReportServer, where<server>is the machine where the Report Server is installed. - It is also recommended to change the OverwriteDataSources property to True, as this way, every time the project is published, the data sources will also be updated.
- After configuring, click Ok.
¶ 8.5.2 Publishing to Report Services
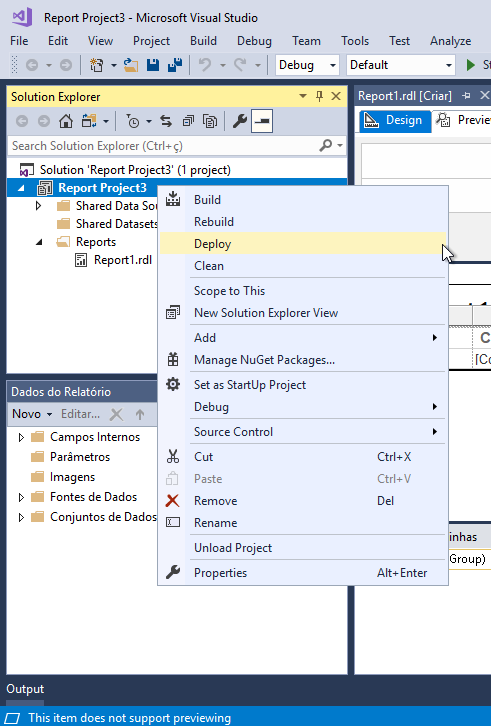
To publish all the project reports on Report Services:
- Right-click on the project name in the Solution Explorer and select Deploy.
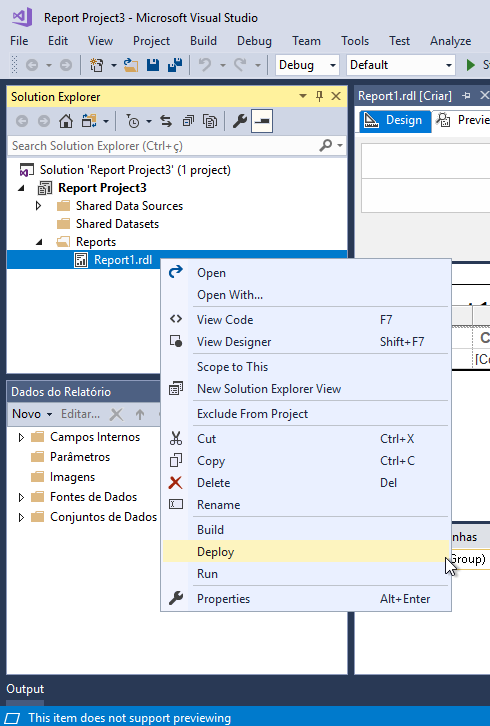
To publish a single report on Report Services:
- Right-click on the report to be published.
¶ 8.6 Synchronizing with T6 Planning
Whenever a new report is included in the Report Server, T6 Planning needs to be synchronized. To do this:
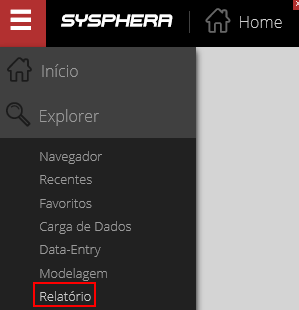
Access the T6 Planning menu and click on Explorer > Report.
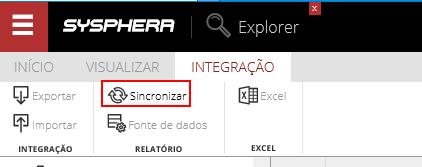
In the Explorer screen, in the Integration Tab:
- Click on the Synchronize option (as highlighted).
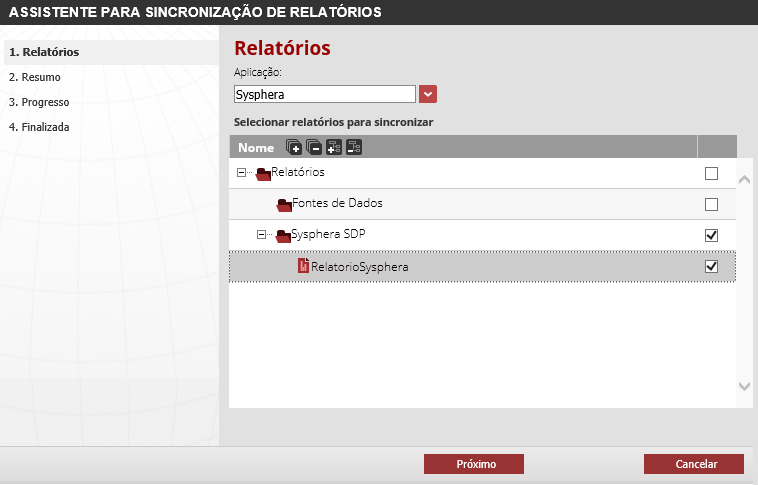
In the Report Synchronization Wizard screen – Reports step:
- Check the reports you want to synchronize.
- Then click Next.
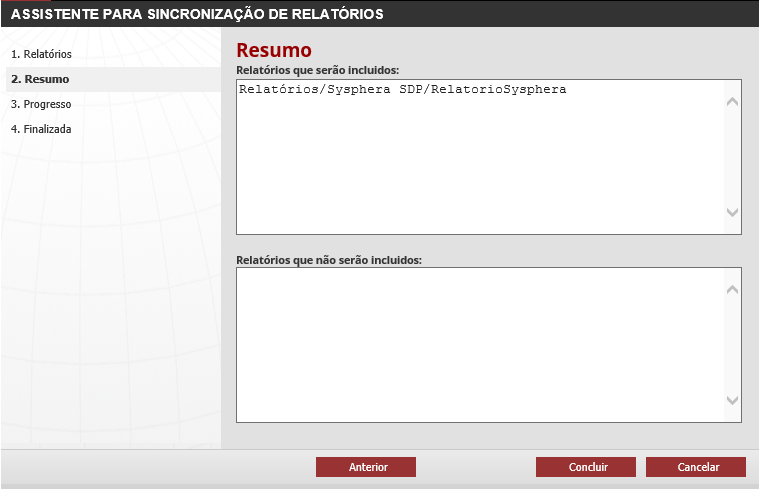
On the same Report Synchronization Wizard screen – Summary step:
- The reports to be included and those not included in synchronization will be displayed.
- To finish, click Finish.
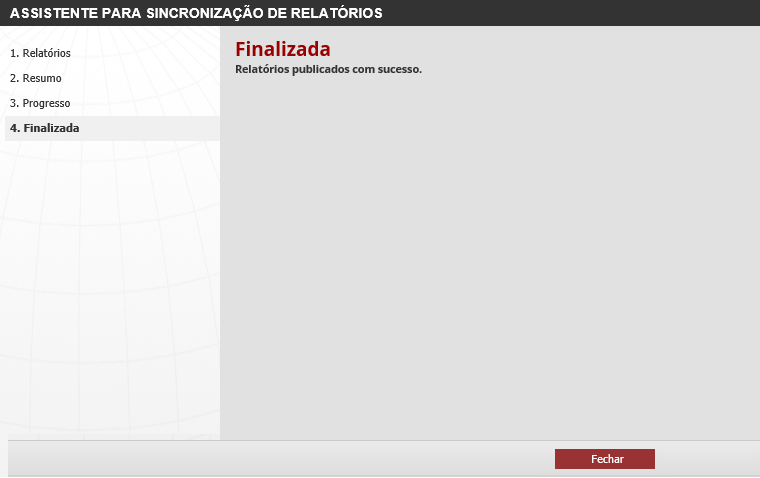
Still on the Report Synchronization Wizard screen:
- The last step will display the message that the reports were successfully published.
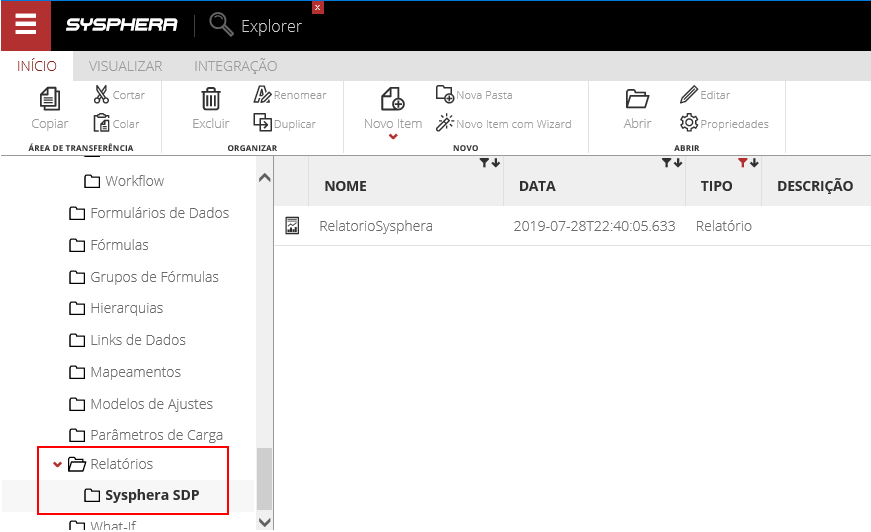
In the Explorer screen:
- Locate the Reports folder of your application on the left side of the screen.
- Click on the folder. The synchronized reports will be displayed in the list of reports in the center of the screen.
¶ 8.7 Viewing the Published Report
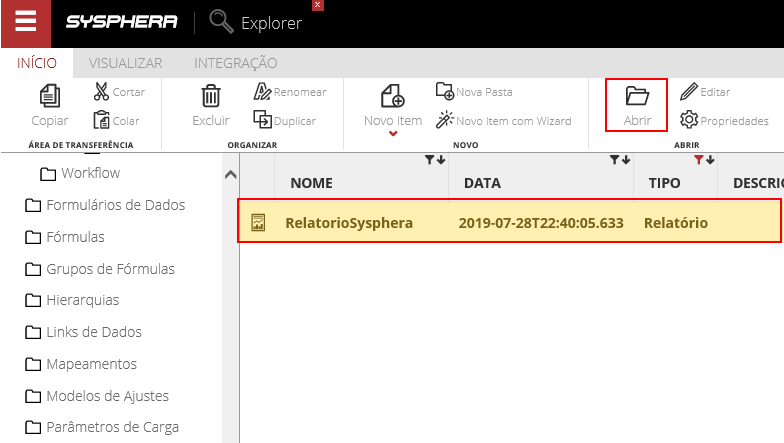
In the Explorer screen – Home Tab:
- In the options bar, click on the Open option as shown in the image below, or double-click on the row of the report you want to view.
¶ 9. Advanced Settings
¶ 9.1 Overview
In this chapter, you will observe various options, techniques, and tips for creating more useful and presentable reports, both increasing their functionalities and improving their layout.
¶ 9.2 Defining Parameters
Parameters are filters created in the report that allow modifying the query dynamically. Below, in subtopics, the steps to make your report parameterizable will be presented.
¶ 9.2.1 Creating the Parameter Query
In 99.99% of parameter usage cases, users are not allowed to define the parameter value with free text, as this facilitates the risk of entering the parameter incorrectly.
For this reason, there are two options to create a list of values with valid items for the parameter:
- Statically (manually creating the list of values).
- Creating a specific dataset for each parameter.
To add a new dataset to your report, follow the steps below.
In the top navigation menu:
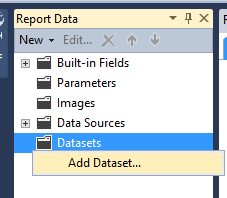
- Click on -> View -> Report Data.
- Then, right-click on Datasets, and choose the Add Dataset... option.
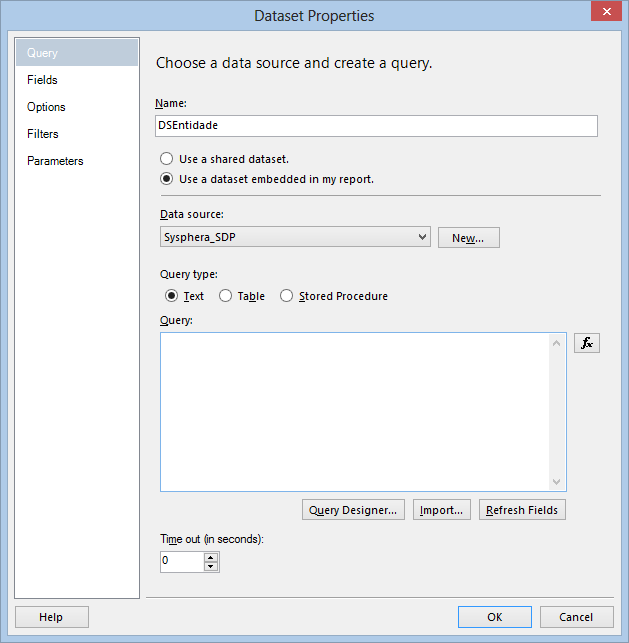
In the Dataset Properties screen:
- On the left side, click on the Query option.
- In the Name field, enter a name for the DataSet, and then check the Use a dataset embedded in my report option.
- In the Data source field, select the same Data Source used in the initial report settings.
- In the Query type field, check the Text option.
- Then, click the Query Designer button to configure the parameter definition to be created.
- To finish defining the query, click Ok.
Clicking the Query Designer button will open the SDP screen for creating the query. Here, two peculiarities must be observed:
- First: Select the Query Type as Parameter.
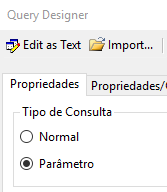
- Second: Allocate only the dimension containing the members you want to use in the parameter and always place it on the COLUMNS axis.
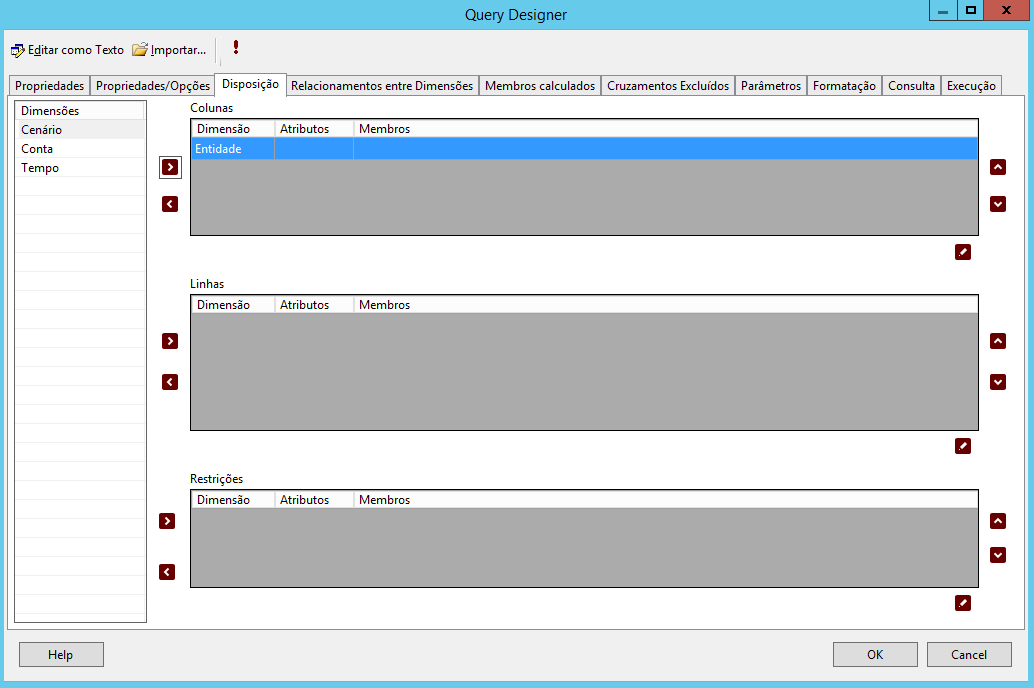
Note: All other axes other than columns will be DISREGARDED when using a parameter query.
¶ 9.2.2 Creating the Parameter in the Report
Report parameters are the actual lists of values that will appear for users. These parameters will be common and can be used by all datasets in the report.
To create a new parameter for your report, follow these steps:
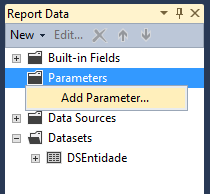
In Report Data:
- Right-click on Parameters and select the Add Parameter option.
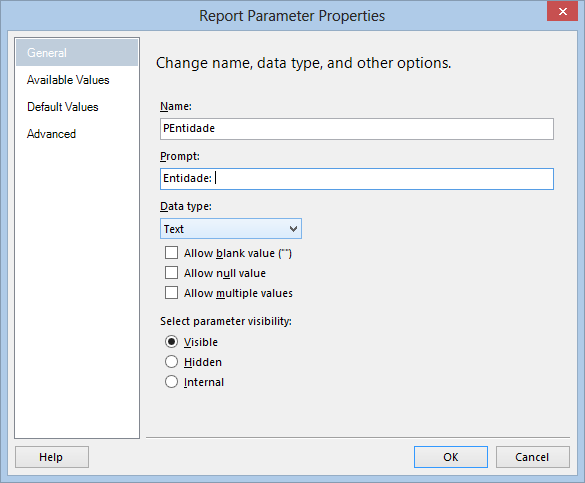
In the Report Parameters Properties screen:
- On the left side, click on the General option.
- In the Name field, enter a name for the parameter. This name must be unique in the report.
- In the Prompt field, enter a title for the parameter.
- In the Data type field, select the Text format.
- In the Select parameter visibility field, check the Visible option. Another option that can be used in some cases is hidden, which hides the parameter from the user.
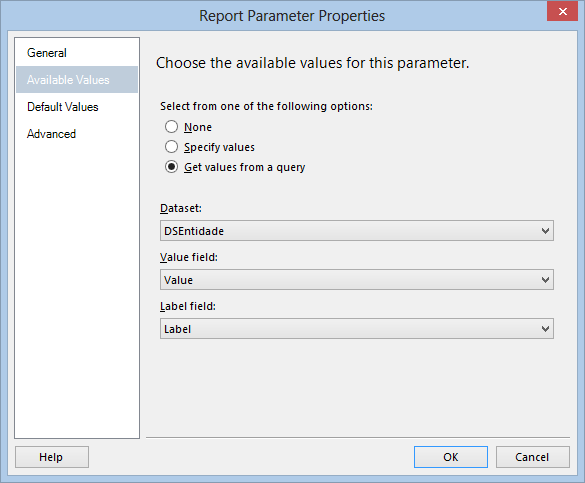
Still in the Report Parameters Properties screen:
- On the left side, click on Available Values. In this step, the parameter's list of values is defined.
- In the Select from one of the following options field, check the Get values from query option.
- Then, select the dataset created for the parameter, and then the Value and Label fields respectively in the Value Field and Label Field properties.
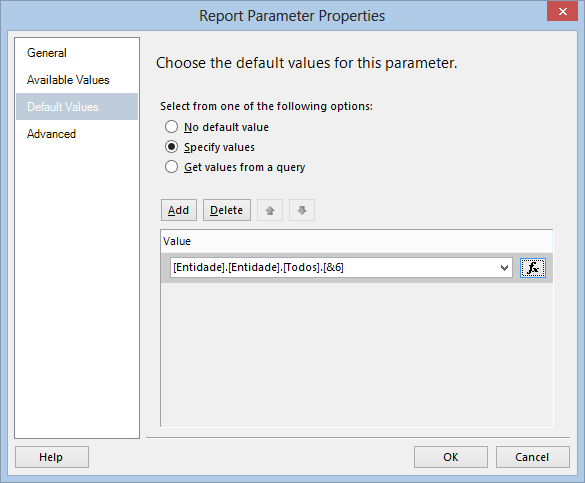
To finish, in the Report Parameters Properties screen:
- On the left side, click on Default Values. Here you can enter a default value for the parameter in the report. This option allows the definition of values that will be filled in the parameters on the first opening of the report.
- In the Select from one of the following options field, check the Specify values option.
- Then, click the Add button and enter the default value you want to use for the parameter.
- To finish, click Ok.
At the end of this step, the parameter will be ready to be used in the report datasets.
¶ 9.2.3 Creating the Parameter in the Dataset
Before using the parameter in the query, you must first add it to the dataset. To do this:
In Report Data:
- Right-click on the dataset you want to add the parameter to, and then click on Dataset Properties.
In the Dataset Properties screen:
- On the left side, click on Parameters.
- In the Parameter Name field, you will define a name for the dataset parameter, which may or may not be the same name as the report parameter.
- In the Parameter Value field, select the desired parameter.
- To finish, click OK.

At the end of this step, you have associated the parameter with the dataset, but the query is not yet using this parameter effectively.
¶ 9.2.4 Using the Parameter in the Query
To make your query start using the dataset parameter created in the previous step, you need to select it in the SDP, on the member selection page.
To select a parameter in the SDP, follow these steps:
In the Query Designer screen – Layout tab:
- Click on the dimension edit that will use the parameter.
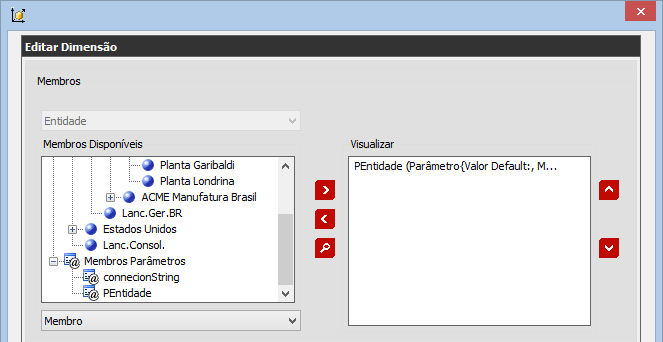
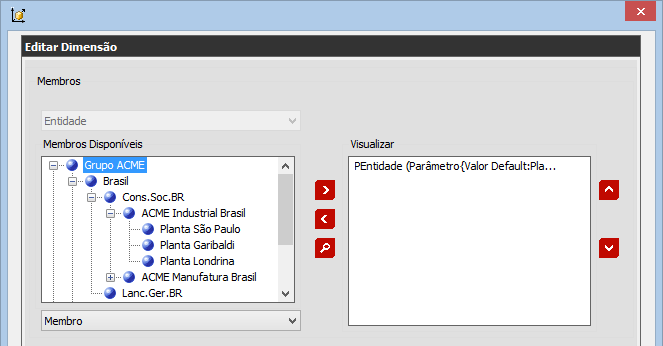
In the Edit Dimension screen:
- Remove the selected member and include the dataset parameter.
- In the Available Members field, select a member that will be the Default Member for the parameter. To do this, select the desired member and drag it over the selected parameter.
- To finish, click OK.
In the images below, you will see an image containing the selected parameter and without a default member (top), and another image containing a selected member and with a default member (bottom).
Note: If the "Available Members" title is displayed in red, it means that some report parameters may not be available for use in the query. If this happens, you will need to save the report and return to this screen.
Note: If a member is not set as the default for the parameter, the process cannot be completed because an error window will appear, stating that "A default value for the parameter has not been set!" Now you can test your report, being able to filter the data dynamically according to your needs.
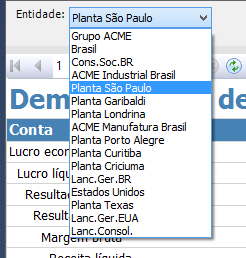
In the report design screen:
- Click the Preview button to view the report. Note that the parameter is now available for user selection.
¶ 9.3 Special Header and Footer Settings
Additional visual settings that you can include in your report. In both the header and footer, you can insert logos, descriptions of parameters used in the query, report generation date, etc.
¶ 9.3.1 Displaying Header and Footer
The first task is to display the header and footer, which are hidden by default in the report. To display the header and footer in your report:
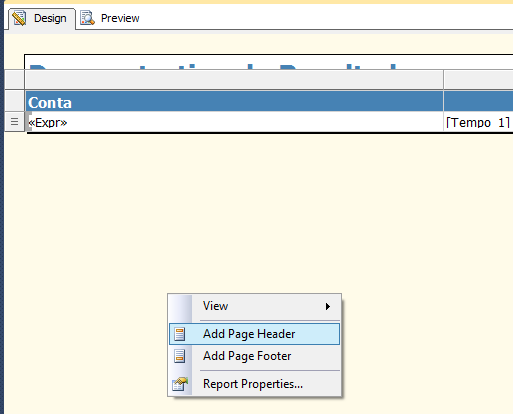
In the Report Design screen:
- Right-click on the empty area of the Design section and then click on Add Page Header and Add Page Footer.
The following are some components that you can include in both the header and footer of your report.
¶ 9.3.2 Inserting a Logo
There are three ways to store and use images within your report. They are:
- Embedded: The image is stored within the report, as if it were part of it, becoming independent for each report.
- External: The image is a file stored with the project files. This image can be modified, and all places where it is used will be updated automatically. It is the most recommended mode.
- Database: The image is stored within the database. Uncommon.
Since both of the above methods have their own characteristics, with pros and cons, the Embedded type will be adopted to exemplify the use of an image in the report. So:
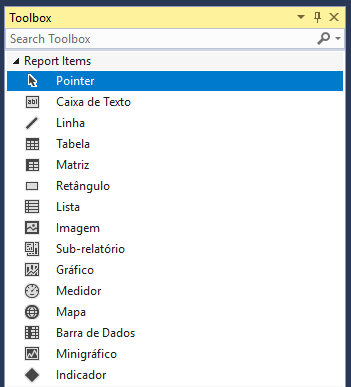
In the Toolbox:
- Select the Image option and drag it to the header (position adopted in this example).
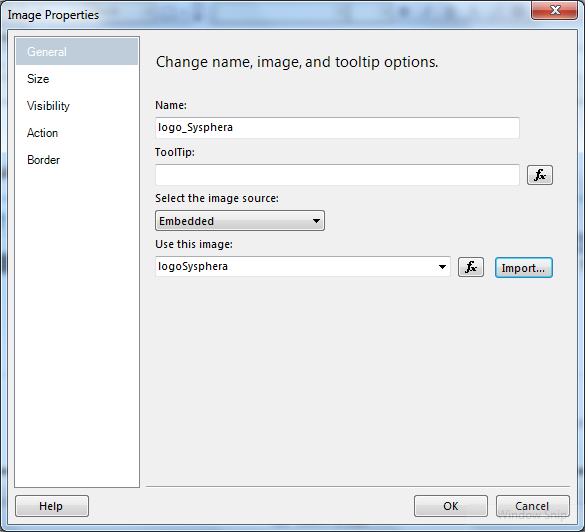
In the Image Properties screen:
- On the left side, click on the General option.
- In the Name field, enter a name for this image.
- In the Select the image source field, choose the desired storage method.
- In the Import field, select the desired image from a local directory.
- On the left side, you can use the other options to configure other properties such as the image size, visibility, and borders.
- To finish the process and insert the configured image, click OK.
¶ 9.3.3 Inserting a Textbox with User Auxiliary Information
Textbox components are the most commonly used graphical items in a report. They are present inside tables and matrices and can be used when it is necessary to present a unit value or information.
To include a textbox, follow the steps below.
In the Toolbox:
- Select the Text Box option and drag it to the chart area.
- Then include the fixed text (static text, such as a title, for example), or configure the expression that will be presented in it.
There are several possible expression options. To edit the expression:
- Right-click on the textbox and select Expression...
Note: Every expression ALWAYS starts with an equal sign.
¶ 9.3.4 Parameters
Whenever a report has parameters, it is interesting that the selected values be presented in the report header. This is because reports can be printed or exported to XLS or PDF. If one of these actions is performed, the reference to which filter was used to generate those numbers is lost.
To include information with parameter values:
- In the report header, include a textbox for each parameter, or concatenate these parameters in a visually interesting way.
The parameter expression format is: =Parameters!<parameterName>.Label or =Parameters!<parameterName>.Value
¶ 9.3.5 Generation Date
Also for the same reason as presenting parameter items, it is important to show the date the report was generated.
To include information with the report generation date:
- In the report footer, include a textbox with the following expression (formatting is necessary because you will be using the date in a string):
="Generated on: " + Format(Globals!ExecutionTime, "dd/MM/yyyy HH:mm")
¶ 9.3.6 Global Functions
There are several other interesting functions that you can use in textboxes, both in the header and in the footer. Here are some examples:
=Globals!PageNumber: Page number
=Globals!ReportFolder: Report folder name
=Globals!ReportName: Report name
=Globals!TotalPages: Total report pages
A common example is to put the current page and the total pages:
=”Page ” & Globals!PageNumber & “ of ” & Globals!TotalPages
¶ 9.3.7 Inserting Squares and Lines
Sometimes it will be necessary (mainly for the aesthetics of the report) to insert some graphical components, such as squares and lines.
Lines are more commonly used when you want to simulate a totalizer or even to separate the header and footer from the rest of the report.
To insert lines:
In the Toolbox:
- Select the Lines option and drag it to the area where you want to position them.
Note: These components are graphical; they do not have data. Their properties are only for defining thickness, line type, colors, etc.
¶ 9.4 Report Drill Settings
Configuring drill within a report allows hiding or showing rows without the need to re-run the query. This is very useful in reports where you want to display an aggregated value and provide the possibility to drill down to show the values that make up that value.
¶ 9.4.1 Creating a New Report
To apply drill settings within a report, it is first necessary to create a new report that uses Drill.
Following the steps in section 7.4 of this manual, observe the exemplification of creating the new report, and then:
In the Query Designer screen: you will define the query properties at each stage of the SDP interface. To do this:
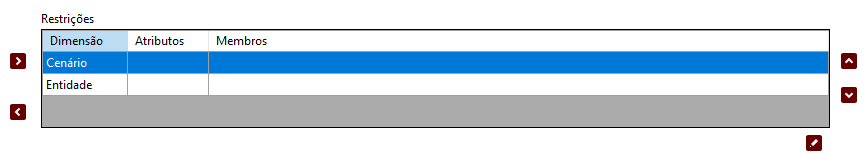
- In the Layout tab: Define "what you want" and "how you want" in your query, configuring the necessary fields, as shown in the image below.
It is necessary to define a hierarchy for grouping values. This must be done in at least one of the dimensions that are in a row.
- To do this, click on the highlighted icon as shown in the image below. In this example, the Product dimension will be used.
Next, the screen for selecting members or attributes of the dimension will be displayed as below. On this screen, select Hierarchy (Level) if you want to maintain the order of the members, select the checkbox to keep the order of the members.
After making the selections, click OK.
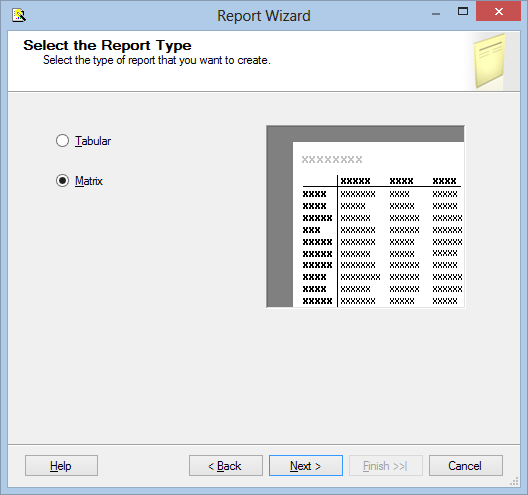
In the Select the Report Type screen: You will begin defining how the query data will be presented. To do this:
- Choose the Matrix option.
- Then click Next.
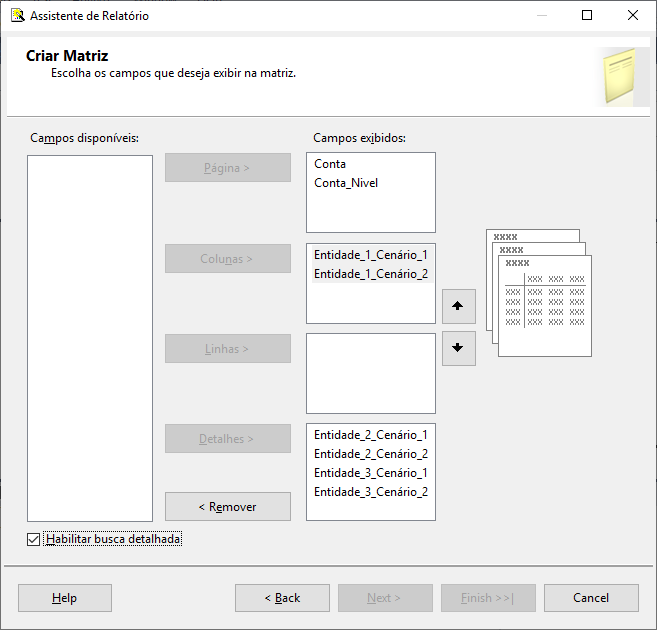
In the Design the Matrix screen: You will distribute the query fields in the Matrix components, as adopted in the example. To do this:
- Place Entity data in Columns, Product data in Rows, and Scenario in Details.
- Check the Enable drilldown option.
- After configuring, click Next.
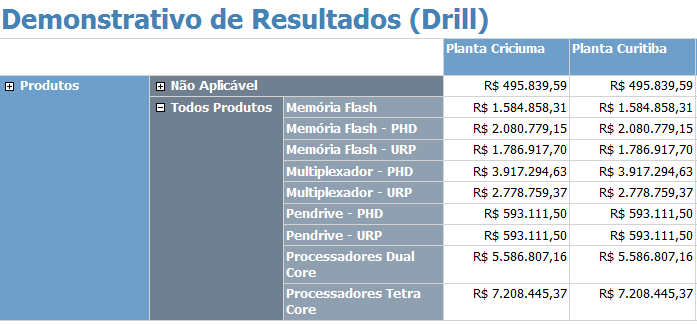
After completing the wizard, you can view the report already enabled with the Drill option, as shown in the image below.
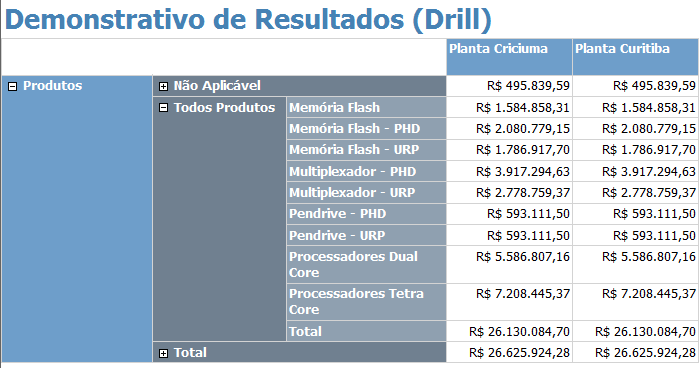
¶ 9.4.2 Configuring Drilldown and Drillup
Note that it is possible to increase or decrease the displayed detail (drilldown and drillup, respectively), and whenever you hide a level, the closed level will be the aggregation of the lower level.
To open and close a level:
- To open, click on the square icon with a "+" sign, and to close it, click on the "-" sign.
By default, in a drill report, the only level that appears open is the first one; all others will be closed. This is uncommon, and normally, either all levels are left open or only the first two or three.
If you want your report to show the first two levels open, proceed as follows:
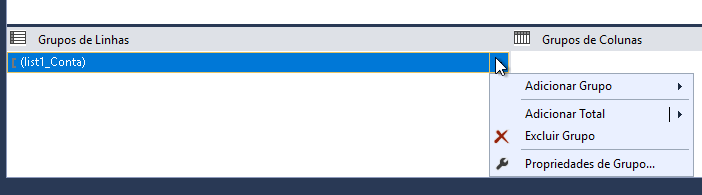
- Right-click on the second level of Row Groups and select Group Properties...
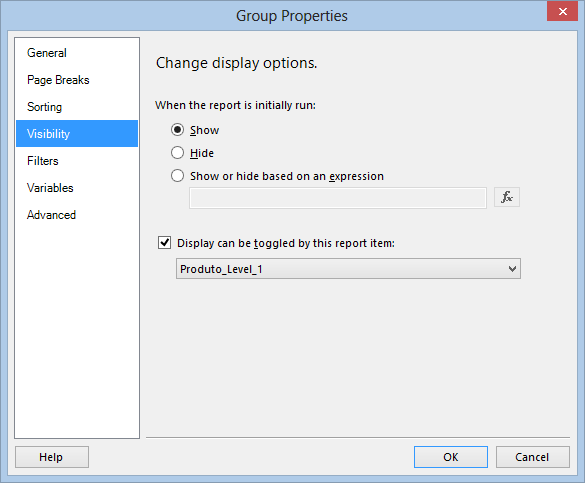
- Navigate to the Visibility tab and change the property When the report is initially run to Show.
- Execute the previous 3 steps again, now for the third level. Note, step 3 (three) should be executed at level 2.
¶ 9.4.3 Hiding "Total" Rows
Another configuration that can be made regarding drill is to hide the rows labeled "Total". This way, whenever a level is open, its total is not displayed, being visible only when it is closed.
To apply this configuration, proceed as follows:
- Right-click on the second level of Row Groups and select Group Properties...
- Navigate to the Filters tab and add a filter, as shown in the image below.
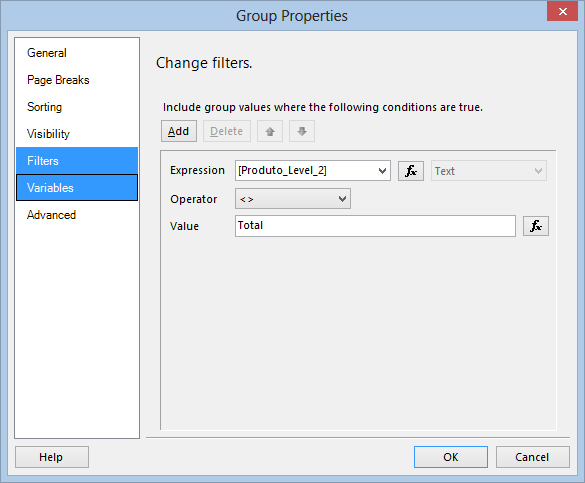
For example, it would look like this:
¶ 9.5 Working with Charts
The use of charts makes it easier to identify trends, historical, comparative, and temporal analyses than analyzing a mountain of data, tables, and matrices.
A chart is always associated with a dataset, so you need to create it as seen in the previous chapters.
With the dataset ready, the next step is to include the chart component and start its configuration. To do this:
- Drag the chart to the desired area of the report.
- The chart type configuration menu should appear.
The three necessary steps for the correct configuration of a chart are presented as subtopics below.
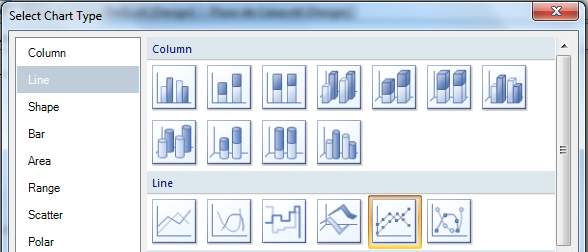
¶ 9.5.1 Defining the Chart Type
The first configuration to be informed is the chart type.
- You should select the type of chart you want to use: line, bar, column, pie, hybrid, etc.
Note: Each chart type has a data requirement for drawing, so depending on how you set up your dataset, you may be able to use a pie chart but not a line chart, for example.
- After selecting the chart type, click OK to confirm. A preview of the chart should appear.
¶ 9.5.2 Defining the Dataset
The next step is to inform the data source of the chart. To do this:
- Right-click on the blank area of the chart and select the Chart properties option.
- In the displayed window, select the Dataset you created earlier from the list that appears in Dataset Name.
- Then make adjustments, specifying where each column of the dataset will be associated.
- To finish, click on the chart. A small window called Chart Data will appear next to it, where you will define the entities that will be allocated in the rows and columns of the charts.
¶ 9.5.3 Defining the Chart Layout
The last step is to define layout settings such as colors, borders, axes (formatting, whether they appear or not...), legend (location, border, color...), titles, shadows, etc.
These settings are defined in the Chart properties option. To access it, follow the steps in item 8.5.2.
¶ 9.6 Printable Reports
A problem that occurs in the vast majority of reports is printing. When you are designing the report layout and there is no size limit, trying to print or generate a PDF of the report will make it unreadable.
Regarding this layout issue, you have three components:
- View Layout: What you see in the browser. The Report Services itself takes care of correcting pagination because there are scroll bars. It is dynamic, and you cannot interfere with it.
- Print Layout: The size of the report page. By default, it is created the size of an A4 page in portrait (height > width).
- Printer Page: The size of the paper being used in the printer.
One way to solve the printing problem of the report is to increase the size of the print layout page so that all report components fit in it.
Make this adjustment on the first page because on the others, Report Services will automatically adjust them.
To adjust the page size:
- In the Report menu, select Report Properties.
- Then, go to the Page Setup tab. In this tab, you can increase or decrease the Margins, Height, and Width of the page.
- You can also change the orientation of the report from Portrait to Landscape.
The process of adjusting the report within the page is done through trial and error. After defining the orientation to adopt, gradually increase the height and width and view the result to see if it looks good or if it needs to be changed a little more.
To view the print layout:
- Run the report in SSDT and click on the Print Layout icon, which is to the right of the print icon.
An important point is to maintain the height and width ratio according to the paper format that will be used. Otherwise, paper utilization will not be efficient.
After making this adjustment, you may still have another problem with printing reports. This happens because depending on the printer driver used, you increased the size of the print layout page, but the printer page size cannot be changed.
To print the report, the printer driver must have the option to Fit Printer to Paper Size. With this, the print layout will be converted to the size of the printer paper, and printing will be perfect.
In some cases, especially with older printers, this option does not exist. So the alternative is to generate a PDF file and print from it.
¶ 9.7 Drill Between Reports
You observed how to drill within a report. Now, you will be instructed on how to drill between reports. This is optional when it is necessary to detail information, show data that is not hidden in the report, and is often with a completely different layout.
This Drill Between Reports is basically a link between two reports, where the first calls the second, passing the parameters automatically. You can place this link in any existing textbox in the first report.
The basic steps to create this link are:
¶ 9.7.1 Create Detailed Report
Any report can be called through a link. This link can be infinite, remaining in an eternal circle (the first calls the second, which calls the third, which calls the first). This can happen when reports are joined without parameters, leaving the link meaningless.
The most common thing is for this report to have parameters that facilitate detailing, such as Time, Account, and Entity parameters, for example.
¶ 9.7.2 Create Master Report
By Master Report, it is understood as the one calling the Detailed Report. This report should have the necessary information to pass to the parameters of the report being called (if it has parameters).
¶ 9.7.3 Define the Link between Reports
The link between reports is always defined in the master report.
To create the link:
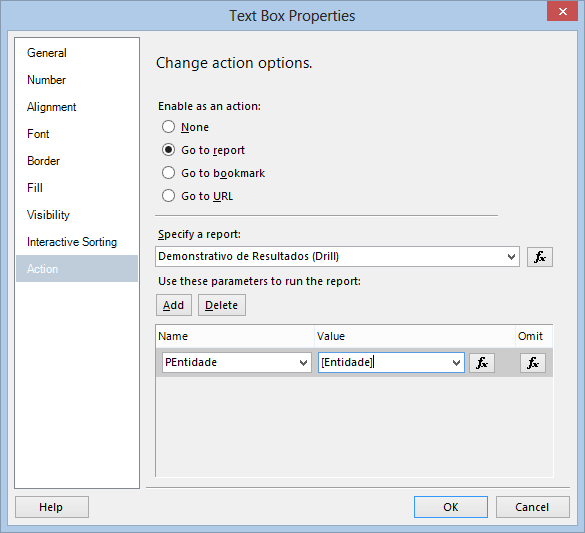
- Go to the properties of the textbox that will have the link.
- In the Action option, select Go to Report.
- Then, in the list of values, select the report you want to navigate to, as shown below.
Note that in this same window, you can already configure the parameters that will be passed between reports. In this case:
- Use an expression because you have to pass a member as a parameter (the value from a parameter dataset), and the information you have is only the name of the member (the label from a parameter dataset).
- At the beginning of the expression, concatenate the names of the dimension and hierarchy.
¶ 10. Important Tips
¶ 10.1 Overview
This final chapter of the manual aims to provide the manager with important tips that the T6 Planning consulting team has acquired over various projects.
¶ 10.2 Parameter Names
An important and widely used functionality is passing some information to reports when accessed through T6 Planning. This makes it possible to pass, for example, the identifier of an Entity or Scenario, user login, or the current year to the report.
Reports within T6 Planning can be accessed using:
- Report Listing (REP): Called from the Reports menu.
- Forms: Called from within forms. They work the same way as those in the REP item above.
- Workflow (WKF): Called from executing a task within the workflow.
These differentiations are important because some parameters only exist in the workflow, such as the entity, for example.
The way T6 Planning interacts with reports is through the names of the parameters. Every time a report is accessed, before being displayed to the user, T6 Planning checks if one of the parameters listed below exists in the report, and the default value is passed.
| Name | Type | Description | Example |
|---|---|---|---|
| codScenarioPlanned | WKF | Planned Scenario ID | 2 |
| codScenarioRealized | WKF+REP | Realized Scenario ID | 1 |
| entity | WKF | Entity Member | [Entity].[Entity].[ACME] |
| scenarioPlanned | WKF | Planned Scenario Member | [Scenario].[Scenario].[Planned] |
| scenarioRealized | WKF+REP | Realized Scenario Member | [Scenario].[Scenario].[Realized] |
| userId | WKF+REP | User ID | admin |
| year | WKF+REP | Current Year Member | [Time].[Time].[2007] |
| month | WKF+REP | Current Month Member | [Time].[Time].[2007].[S1].[T1].[January] |
¶ 10.3 Enabling SDP Cache
With each query performed by SDP, either for the report or for the parameters, SDP will query the structural information of the model. This activity generates significant additional processing that can be eliminated by enabling the SDP cache.
To enable this cache, it is necessary to configure the following parameters in the T6 Planning portal parameter window as follows:
- reportingServicesCache: A boolean parameter that informs whether the cache is enabled or not. Possible values: "True" or "False".
- reportingServicesCacheLifeTime: An integer representing the lifetime in seconds of cached objects.
- reportingServicesCacheLog: A boolean parameter that informs whether the cache should write information to Windows events, in the T6 PlanningDataProvider category. This option should only be enabled when you want to identify a problem, otherwise, a lot of information will be included in the events, requiring sporadic cleaning. Possible values: "True" or "False".
Note that SDP will only load the parameter values on the first run of the application. If you want to change any parameters, you must modify them and then restart the ReportingServices application.
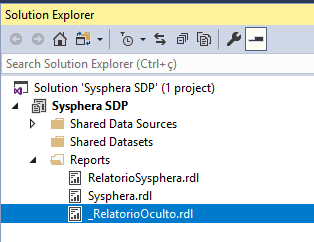
¶ 10.4 Reports Hidden in T6 Planning
Often there is a need to hide certain reports so that they are not visible to users in the T6 Planning listing. This occurs, for example, in detail reports that do not make sense to be accessed directly because their information depends on passing several parameters, which are passed through drill-down configurations in another report.
To make a report hidden in T6 Planning, just start its name with an underscore. For example: _HiddenReport.rdl