¶ 1. Overview
Within T6, we have the profitability analysis tool, which enables the evaluation of different financial scenarios applied to a given application based on multiple dimensions and variables. This analysis process provides a detailed view of financial outcomes by modeling and simulating variations in factors that directly impact profitability.
¶ 1.1. Prerequisites
To create and execute profitability analyses:
The user must be an active user and have the Multi-Applications Administrator flag enabled.
As a Manager, the user must have the following permissions:
Additionally, the user must be associated with a Global Group with the following permission enabled:
¶ 2. Functionality
With the T6 profitability analysis tool, it is possible to create, configure, and adjust specific analyses to assess performance in different scenarios and predict future impacts, enhancing strategic decision-making.
¶ 3. Creating the Profitability Analysis
To create a profitability analysis within T6, follow these steps:
- In the main T6 menu, under Analysis, select the Profitability Analysis option;
- Click New Item on the ribbon, expand the Analysis option, and select Profitability Analysis. A new analysis object will be created;
- Open the created object by double-clicking on it or selecting the object and clicking Open on the ribbon;
- You will be redirected to another screen where you will configure the profitability analysis object.
You can view only "analysis" objects created from the explorer by changing the object filter to the Analysis type.
- In the first step, under Initial Settings, you can select an existing analysis object to use as a template (leave this option blank in our example). Define the application you will use for the analysis, then select a base dimension (in most cases, select the Account dimension). Also, set the number of decimal places each driver will have. After configuring these items, click Next;
- On the next screen, configure the Resultants, which are the values you want to analyze. Click Add and select the members you wish to analyze;
The Resultant must always be a member that contains children or is part of a calculation result.
- On the next step, you can further filter the resultant by applying a context to it. To do so, click the
 , define the resultant member context, and click Ok (this step is optional);
 - In the next step, configure the Drivers (members that affect the resultant). A list of available drivers for selection will appear. Select the drivers you want to display and click
 . After selecting the drivers, click Next;
 - In the next step, you can further filter the drivers by applying a context to them. To do so, click the , define the context for the selected members as drivers, and click Ok (this step is optional);
- In the next step, you can set default pages on opening. (Since we selected the Account dimension as the base dimension, the remaining dimensions will be displayed as pages on this screen.) Configure a default value for opening these pages;
- As you advance, you have the option to add pre-created Data Links by selecting the data link from the list and clicking . To proceed, click Next;
- On the next screen, you can attach a reporting services report to be viewed within the profitability analysis by selecting it from the dropdown menu or inserting the URL of an external report;
- Click Next to proceed to the Summary step, where you can review the configurations. If changes are needed, click Previous. If the configurations are correct, click Finish;
- Upon clicking Finish, the profitability analysis configuration screen will close, and you will return to the Explorer screen, now with the configured object.
¶ 4. Executing the Profitability Analysis
- Open the previously created object by double-clicking on it or selecting the object and clicking Open on the ribbon;
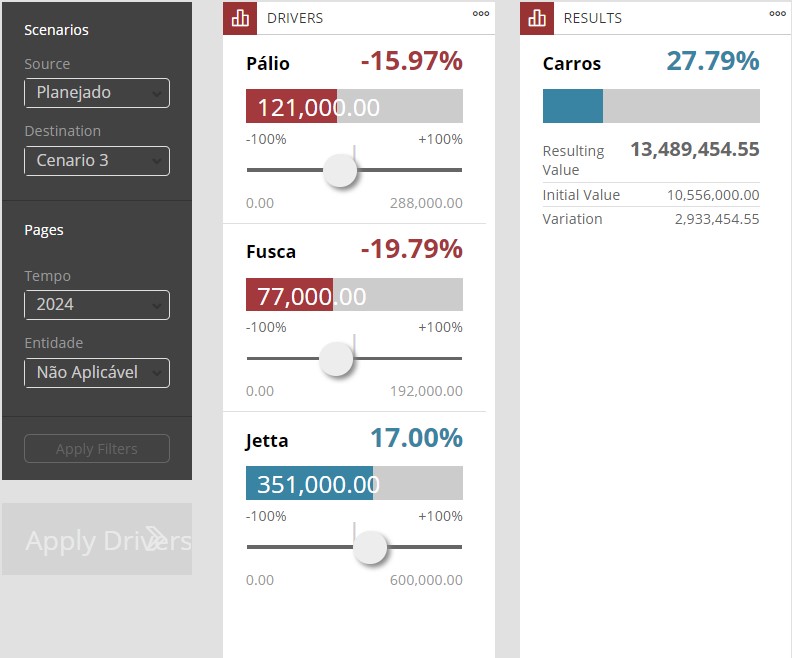
- Upon opening the object, three "blocks" will be displayed: Scenarios and Pages, Drivers, and Results.
To perform simulations, always create a new scenario, as changes made by adjusting the drivers’ variation bar will directly affect the scenario defined as the target scenario. To do this, click New Scenario on the ribbon.
If needed, click Edit Scenario on the ribbon to change the scenario type (defining a scenario as closed will prevent further modifications). Changes will only affect the intended period and will not impact undesired periods.
- In the Scenarios and Pages block, under Scenario, define the source and target scenarios to simulate variations between them. Under Pages, define the scope of the time and entity dimensions you wish to analyze. After making your selection, click
 ;
;
- In the Drivers block, there is a bar with a marker that, by default, is in the middle, representing a 0% variation. Moving the marker to the right increases the variation, up to a maximum of 100%. Moving it to the left decreases the variation, down to a minimum of -100%. To view the results of the variations, click
 , which will reflect the changes in the value and variation displayed in the Results block.
- In the Results block, the selected Resultant member configured in the setup phase is displayed.
The percentages displayed in the Drivers and Results blocks represent the percentage of variation between the values of the selected scenarios.
¶ 5. Q&A
Frequently Asked Questions
1. What are the prerequisites to use profitability analysis?
To use profitability analysis in T6, some prerequisites are required:
You must be an Active User with the Multi-Applications Administrator flag enabled.
You must have the Manager features Create and View Data Entry Forms and Create and View Profitability Analysis enabled, and also belong to a Global Group with the Manage Explorer feature enabled.
2. In profitability analysis, what is the "base dimension" and which one should I choose?
In T6 profitability analysis, the base dimension is the main dimension of the analysis.
In most cases, we recommend selecting the Account dimension.
3. What are "Resultants" in profitability analysis?
In T6 profitability analysis, resultants are the values you want to analyze. They must always be members that contain children or are part of a calculation.
4. What is the difference between Resultants and Drivers in profitability analysis?
In T6 profitability analysis, we have the following concepts:
Resultants are what you want to analyze (the outcome).
Drivers are the members that affect that outcome.
5. Why should I create a new scenario for simulations in profitability analysis?
When using profitability analysis in T6, changes made to drivers directly affect the target scenario. Creating a new scenario prevents impacts on existing data.
6. How does the driver variation bar work in profitability analysis?
In T6 profitability analysis, the variation bar goes from -100% to +100%, with 0% in the middle.
Moving the variation bar to the right increases the value; moving it to the left decreases the value.
7. In T6 profitability analysis, can I use an existing analysis template?
Yes. In T6 profitability analysis, at the Initial Settings step, you can select an already created analysis object as a template.
8. Is it possible to filter resultants and drivers in profitability analysis?
Yes. During T6 profitability analysis setup, you can apply specific contexts to both resultants and drivers.
9. Can I integrate external reports in T6 profitability analysis?
Yes. During T6 profitability analysis setup, you can link Reporting Services reports or add external report URLs.
10. The Profitability Analysis option does not appear in the menu. What should I do?
If profitability analysis does not appear, check whether you have all required features, especially whether the "Multi-Applications Administrator" flag is enabled for your user.