¶ 1. Overview.
Predictive analytics is a branch of advanced analytics that makes predictions about future outcomes using historical data combined with statistical modeling, data mining techniques, and machine learning. It is used to identify patterns in this data in order to detect risks and opportunities.
¶ 1.1 Applications.
Predictive analytics can be used for several purposes. Some of the most popular predictive analytics models are:
- Classification models: categorize data based on historical information, describing relationships within a dataset.
- Clustering models: group data based on similar attributes.
- Time series models: use different input data at a specific time frequency.
- Other applications: fraud detection, credit risk assessment, demand forecasting, marketing optimization, predictive maintenance, etc.
¶ 2. How It Works.
- To run predictive analytics, a historical data set is required (minimum of 36 months);
- It analyzes every existing data window in the application within the Realized scenario;
- The data is sent to an API;
- The API executes the algorithms and checks the best method to use;
- After selecting the best method, the API returns the data as a chart.
If the selected scenario does not contain enough data, the following message will be displayed: "You need to have at least 36 periods to use predictive analytics".
Keep in mind that prediction quality depends on the quality and reliability of the presented data.
¶ 3. Usage.
User guidance on how to select and configure the cube form for analysis, activate and interact with predictive analytics, review form data, interact by changing values, and also hide and reuse predictive analytics.
¶ 3.1 Enabling Predictive Analytics.
- Select the cube form that will be analyzed;
- Select the form row to be analyzed;
- Open the Tools tab at the top of the screen;
- In the Cells section, select Predictive Analytics.
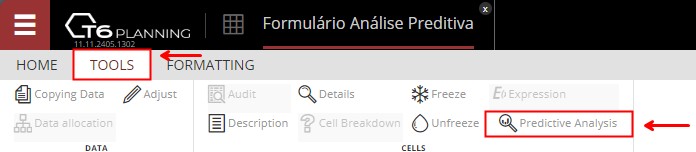
- In the Cells section, select Predictive Analytics.
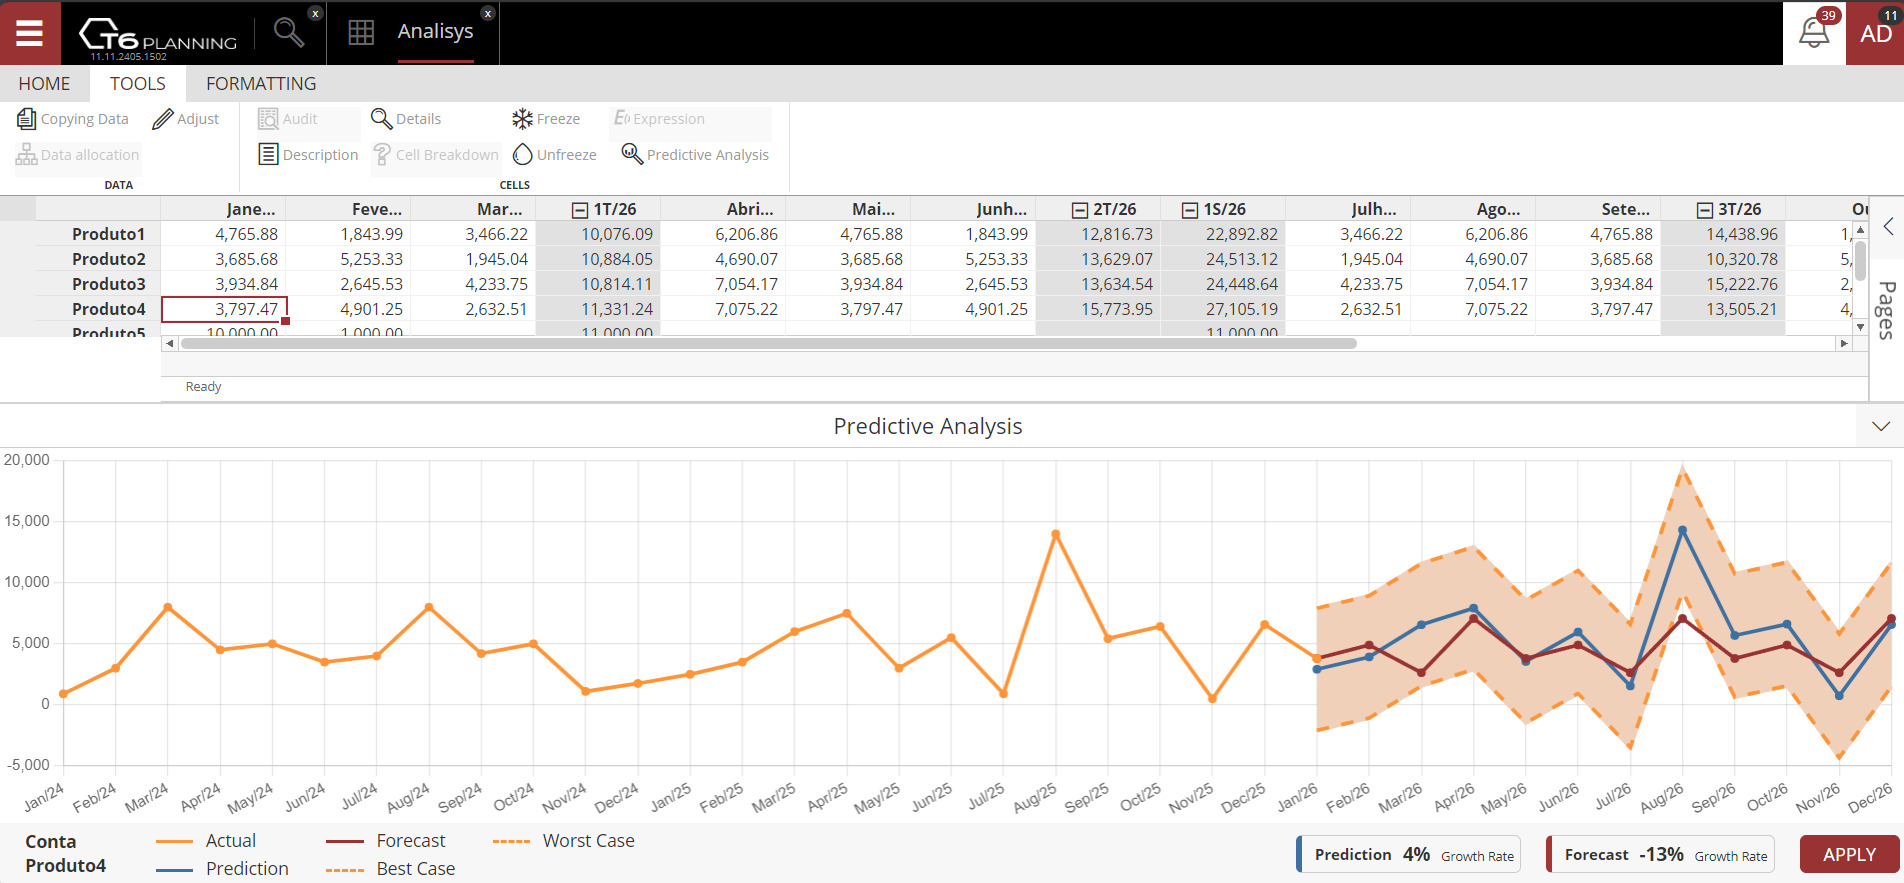
- A panel with the predictive analytics chart opens at the bottom of the screen, showing by default a 2-year result from the Realized scenario data;
- Clicking Predictive Analytics again in the cells section closes the service.
On first use, response time is usually a bit slower because the tool is analyzing data from the Realized scenario and selecting the algorithm with the lowest internal error rate. After the first run in the form, subsequent rows execute instantly because the algorithm and parameters were already selected.
- When you change cell values in the selected row, the chart updates in real time;
- Click apply so that selected-row cells are filled based on the prediction.
You can use predictive analytics to populate form data by clicking Apply, which uses prediction values to fill missing data in the selected row.
By clicking Apply, the forecast and prediction lines on the chart become equal.
¶ 3.2 Minimize and Restore.
- To minimize predictive analytics, click the icon
 on the right side of the opened panel.
 - To restore predictive analytics, click the icon
 on the right side of the panel.
¶ 4. Chart Legend.
-
The orange line represents realized values.

-
The blue line is the forecast, showing what was calculated according to the specific AI algorithm.
-
The red line is the data entered in the form, comparing realized data and prediction results.
-
Dotted lines define a margin based on forecast values, indicating the best and worst cases within the scenario.

-
Forecast is a statement about what is expected to happen in the future, based on current evidence and analytical methods. It is an estimate or projection of what may occur.
-
Prediction is a statement about what is likely to happen in the future, often based on patterns observed in the past. It is an assertion about the expected result of a future event.
¶ 5. Algorithms Used.
Predictive analytics tests the following algorithms:
It checks the data and automatically selects the algorithm with the lowest error rate.
¶ 5.1 Checking the Algorithm in Use.
Hover over the forecast legend to display a tooltip with the name of the algorithm currently being used.
¶ 6. Q&A
Frequently Asked Questions
1. What is predictive analytics?
Predictive analytics is a branch of advanced analytics that makes predictions about future outcomes using historical data combined with statistical modeling, data mining techniques, and machine learning.
2. What is the difference between forecast and prediction?
The difference is in focus and basis.
Forecast focuses on estimating what may happen in the future based on current evidence and analytical methods.
Prediction focuses on identifying what is likely to happen in the future based on patterns observed in the past.
3. How much historical data is required to use predictive analytics?
To use Predictive Analytics in T6, at least 36 months of historical data are required.
If there is not enough data, the message displayed is: You need to have at least 36 periods to use predictive analytics.
4. Where does the data come from to run predictive analytics?
Predictive analytics uses historical data from the Realized scenario.
Data is analyzed across every existing window in the application within the Realized scenario. After opening a cube form that contains at least 36 months, predictive analytics can be applied.
5. How do I enable predictive analytics?
To enable predictive analytics, follow these steps:
- In the T6 Main Menu, go to Explorer;
- Select the cube form you want to analyze;
- Select the form row to be analyzed;
- In the Tools ribbon, in the Cells section, click Predictive Analytics;
- The predictive analytics panel opens at the bottom of the screen and displays the analyzed chart.
6. Why is the first use of predictive analytics slower?
The first time Predictive Analytics is used, the tool is analyzing data and selecting the best algorithm to use based on the lowest error rate. After that, subsequent uses are executed instantly.
7. How do I apply predictive analytics results to the form?
After completing predictive analytics, click Apply so forecast values automatically fill missing data in the selected row. Save changes before closing the form.
8. What do the different lines in the predictive analytics chart represent?
Each line in the chart has a specific meaning:
Orange line: realized data;
Blue line: forecast calculated by the algorithm;
Red line: data entered in the form;
Dotted lines: best-case and worst-case margins.
9. How do I minimize or restore the predictive analytics panel?
To minimize or restore the predictive analytics panel, use the minimize/restore icons located on the right side of the panel itself.
10. Which algorithms are used in predictive analytics?
Predictive analytics tests the following algorithms and automatically selects the one with the lowest error rate:
Holt Linear;;
Holt Winter;;
ARIMA;;
SARIMA;;
AUTO ARIMA;;
Prophet;;
ETS (Exponential Smoothing)..
11. How can I check which algorithm predictive analytics is currently using?
After enabling predictive analytics, hover over the forecast legend and a tooltip will display the algorithm name currently in use.