¶ 1. Overview
Data Explorer is a tool that allows us to navigate between different hierarchical levels within a form, providing a detailed view of selected data. Data Explorer enables both analysis at more granular levels and returning to higher levels quickly and dynamically. In addition, extra features such as value explanation and dimension layout customization make the analysis process more efficient and flexible.
¶ 1.1. Prerequisites
To use the tools available in Data Explorer, no specific prerequisite is required; only read permission for the desired object is needed.
¶ 2. Features
Data Explorer provides tools to view different hierarchical levels of a form without needing to switch screens, allowing navigation between different data levels. With it, you can explore details of child members or return to higher levels, ensuring flexibility in information display. It also allows analysis customization, such as selecting specific dimensions for drill operations and undoing or clearing performed actions. In addition, features such as detailed value explanation and dynamic dimension reorganization make the analysis process more efficient and intuitive.
¶ 3. Usage
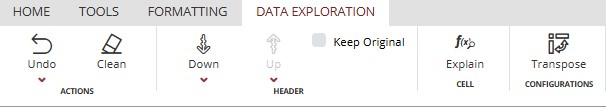
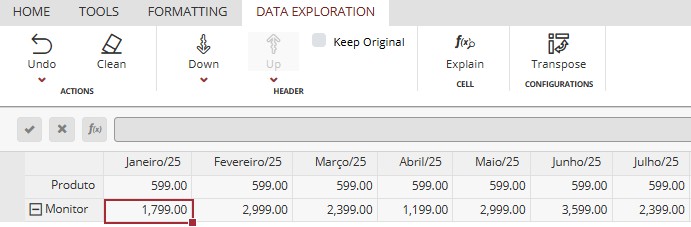
When we open a form in T6, in the ribbon, we will find the Data Exploration tab.
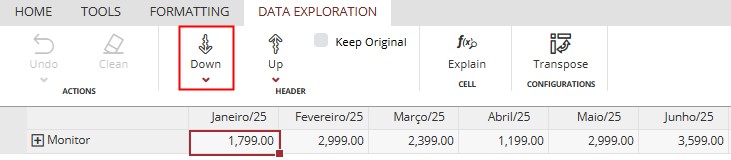
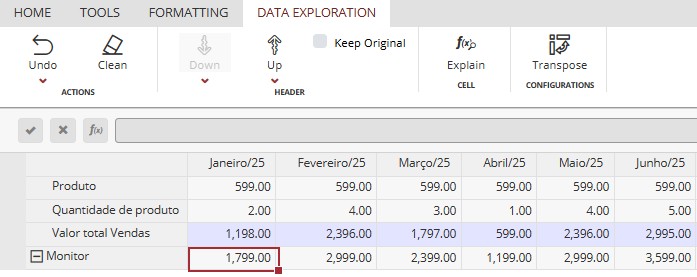
When we select, in the form, a member that contains children and click Down, the child members of the selected member and their data are displayed. If the displayed members also contain children, we can select one of them and click Down again to display the children of that selected member;
If you want the parent member to continue being displayed together with the child members, check the "Keep Original" checkbox. All applied Down drills will keep the parent members and display the child members of the selected member;
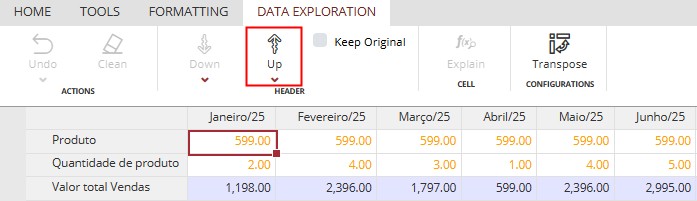
We also have the Drill Up option. If the form displays leaf members, we can click Up so that the parent members of the selected member are displayed;
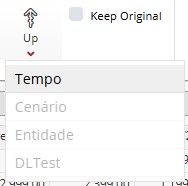
In the Down and Up drill buttons, we also have a dropdown. When we click it, dimensions are displayed. Click the desired option and the drill will be applied to the selected dimension (when clicking the dropdown, all dimensions are displayed, but only those available for interaction are highlighted in black);
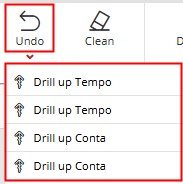
We also have the Undo button. When we click it, we return to the last action performed. We can click the Undo button directly to go back action by action, or we can click its dropdown to display all actions performed and select which step we want to return to, including returning all actions at once;
We also have a Clear button, which reverts all drill actions performed in the form, returning the form to the default opening page;
When we select a value cell and click Explain, the form is adjusted to display the value breakdown. We get a list with values of each member shown in a hierarchical tree format. When we select one of the displayed values, an expression is shown at the top of the screen explaining how that value was generated.
When a cell value comes from another application through a Data Link, clicking Explain makes Data Explorer automatically recognize the Data Link configuration and navigate to the source application context, displaying the value composition without leaving the form. By clicking Undo, you return to the previous context while keeping the cell selection you were analyzing.
If a cell has a formula that uses a data table to perform the calculation, clicking Explain displays the data table data as a form, making data visualization easier without leaving the form we are working in. By clicking Undo, we return to the form without losing the context we were analyzing.
For example:
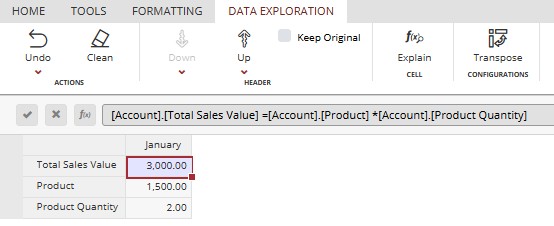
In the open form, we select a cell from the Monitor member and click Explain. In the listing with members and values, we select the value from the Total Sales Value member. In this case, the following expression will be displayed: [Account].[Total Sales Value] = [Account].[Product] * [Account].[Product Quantity]. This means the Total Sales Value equals the Product value multiplied by the Product Quantity value.
We can also click on the Total Sales Value member value to select it and then click Explain again. A new screen will open showing the value of the selected member and the members that generated this value. In our case, the Product and Product Quantity members.
After using Explain through the ribbon for the first time, subsequent uses can be done directly on the desired cell, with a double click on the cell.
Another possibility is viewing the use of functions in formulas applied to a cell.
We can use the GetApplicationData function to bring values from one application to another. By using the Explain tool, we can see the formula used to generate that value, without leaving the form.
For example:
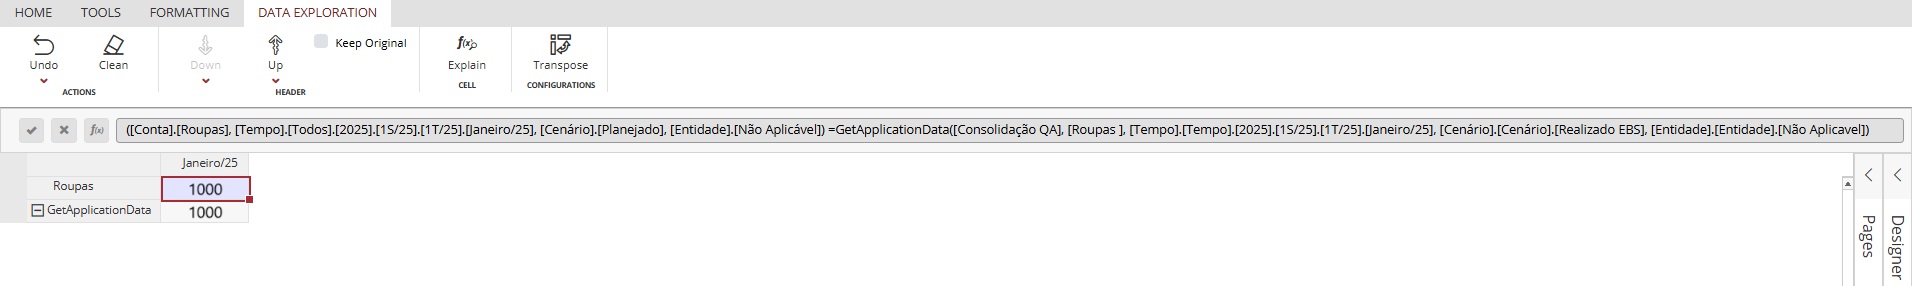
In the bar displayed when we click Explain, we have the following expression: ([Conta].[Roupas], [Tempo].[Todos].[2025].[1S/25].[1T/25].[Janeiro/25], [Cenário].[Planejado], [Entidade].[Não Aplicável]) =GetApplicationData([Consolidação QA], [Roupas ], [Tempo].[Tempo].[2025].[1S/25].[1T/25].[Janeiro/25], [Cenário].[Cenário].[Realizado EBS], [Entidade].[Entidade].[Não Aplicavel]). This is the formula expression used to bring values from one dimension to another.
We can see that the source of the value for the Roupas member in the Account dimension in the Current Application comes from the Consolidação QA application, from the Roupas member in the Account dimension, in Janeiro/25, in the Realizado EBS Scenario.
We can also use the GetDataTableData function, which brings data through a Data Table. When we use Explain, the formula used to bring the values is displayed.
When we select the Data Exploration tab, a new side panel named Designer is also displayed. When we click it, it opens and shows the layout of rows, columns, and pages of our form, allowing us to change the layout dynamically without switching screens. We only need to click the desired dimension and drag it to the desired section;
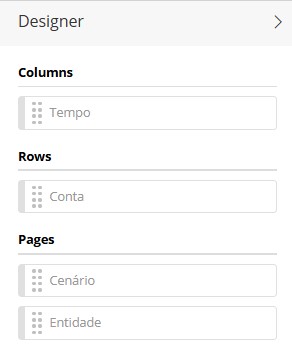
The Columns and Rows fields must mandatorily have an associated dimension. If either of these fields has no dimension, the form becomes invalid and data will not be displayed until the layout is adjusted.
The only field that can be left empty is the Pages field.
¶ Transpose
We can also transpose rows and columns so that dimensions that were displayed in rows are displayed in columns, and dimensions that were displayed in columns are displayed in rows. To do this, click the Transpose button.
¶ 4. Q&A
Frequently Asked Questions
1. What is the T6 Data Explorer?
T6 Data Explorer is a tool that allows navigation between different hierarchical levels within a T6 form, providing a detailed view of selected data without needing to switch screens. It also includes additional features such as value explanation and dimension layout customization.
2. Do I need special permissions to use Data Explorer?
No. If the user has read permission for the desired object, Data Explorer can be used.
3. How do I perform drill down in a form?
To use drill down, after opening the form, select a member that contains children and click Down on the ribbon. The child members will be displayed with their data.
4. What happens if I check "Keep Original" when applying Drill?
When the Keep Original option is checked, all applied Down drills keep the parent members visible together with the child members.
5. How do I return to a higher level after applying Drill?
After applying Drill down, use the Up button on the ribbon to display the parent members of the selected member.
6. Can I drill on specific dimensions?
Yes. After opening the form, click the dropdown of the Down or Up buttons and select the desired dimension to apply the drill.
7. How do I undo a drill action?
To undo a drill action, click the Undo button to return to the last action, or use the dropdown to select a specific step.
8. What is the difference between "Undo" and "Clear" in drill?
The difference is that the Undo button returns action by action, while Clear reverts all drill actions at once, returning to the default page.
9. How does the "Explain" tool work in forms?
Select a value cell and click Explain on the ribbon.
The form will show the value breakdown in a hierarchical tree. When selecting one of the displayed values, an expression is shown indicating how that value was generated, including displayed formulas and functions.
10. Can I view data table data through "Explain"?
Yes. Through Explain, if the cell uses a data table, the data is displayed in form format within the same screen.
11. What does the "Transpose" button on the ribbon do?
When clicking the Transpose button, dimensions are swapped: what was in rows goes to columns, and vice versa.
12. Can I apply multiple drill levels in the form?
Yes, you can continue drilling down by selecting child members successively, as long as they have children available.
13. How do I return to the original context after using "Explain"?
After using Explain, click Undo to return to the original form while keeping the analysis context.
14. Does "Explain" work when the value comes from another application via Data Link?
Yes. If a cell has a value from another application through Data Link, when clicking Explain, Data Explorer automatically navigates to the source application context and performs the drill there. Use Undo to return to the original context.