¶ 1. Overview
Telemetry is an essential technology for collecting, transmitting, and analyzing remote data to a central system, enabling efficient monitoring and management of the system and its processes. It facilitates real-time tracking of critical parameters. By integrating sensors, communication systems, and data analysis platforms, telemetry enhances efficiency, safety, and accuracy in resource and process management.
The importance of telemetry is to streamline the application analysis processes, allowing you to visualize where errors are occurring, make comparisons between applications of different users, and identify causes of system slowdowns and bottlenecks.
OpenTelemetry is an observability framework and toolkit designed to create and manage telemetry data, such as traces, metrics, and logs. Currently, we are only using OpenTelemetry traces in the system.
¶ 1.1 Prerequisites.
For telemetry to be enabled within T6, add an entry in your appsettings.json to specify the URL where telemetry data will be sent. As shown in the example below:
{
 "TELEMETRY_TRACE_URL" : "<check the endpoint address with an administrator>"
}
For telemetry to work, after adding the URL entry, you need to run T6 Enterprise. If T6 is already running, stop it and start it again.
¶ 2. Specifications.
Tracing: Whenever we want to measure the time consumption of an action, we use tracing, which internally has an object called a "span".
Logs: A log is simply an event at a specific moment during the execution of an action.
Metrics: We can add and create metrics in the product. An example of a metric could be the number of requests per second.
Tag: A tag is an attribute that we place on a span.
Baggage: The difference between baggage and a tag is that baggage belongs to the hierarchy of spans. In other words, any span that inherits from a span containing baggage will inherit it as well.
Below is an example of a trace composed of 6 spans (causal relationships between spans in a single trace):
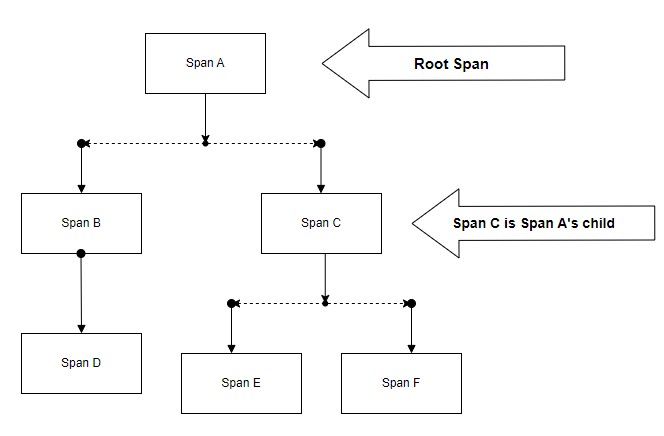
Our first unit is the request (span A). Among the properties of the span, we have a start time, an end time (allowing us to determine its duration), and internal points. Within a span, we can have several other spans. The span can have tags, enabling us to filter and identify the span in the future.
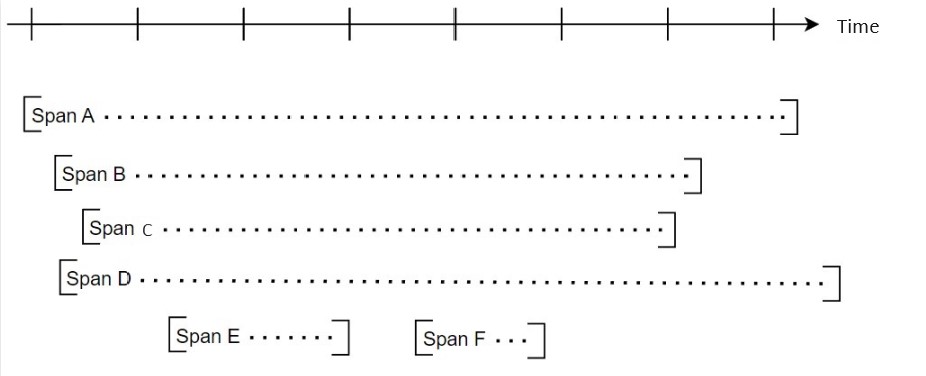
Sometimes it's easier to visualize traces with a timeline, as shown in the image below:
For additional information, visit OpenTelemetry.
¶ 3. Implementation.
OpenTelemetry supports the protocols gRPC (Google Remote Procedure Call) or Proto Buffer.
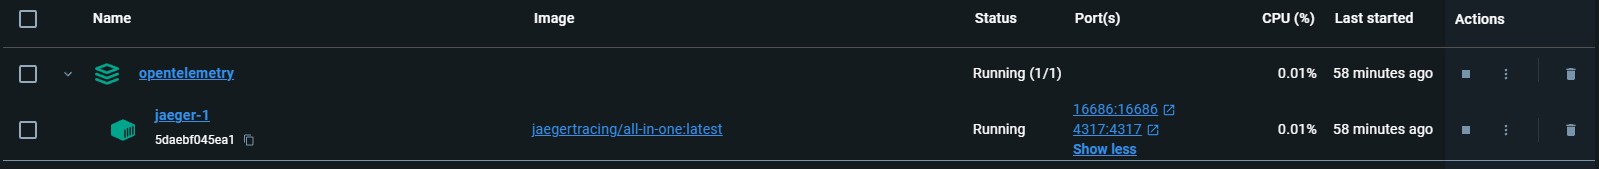
To visualize its operation, we can use Docker, which allows you to create, deploy, and manage files in containers, ensuring that software and its dependencies run in any environment, along with the Jaeger project, an open-source telemetry data visualization tool. It receives information from T6 Enterprise.
With Docker running, we'll execute the docker-compose.yml file (a file used to define and run multi-container Docker applications) that will enable the Jaeger container with the target port so we can access it on the web.
Here is an example of a docker-compose.yml file:
Click to expand and view the docker-compose.yml file contents
version: "3.5"
services:
  jaeger:
    networks:
      - backend
    image: jaegertracing/all-in-one:${JAEGER_IMAGE_TAG:-latest}
    volumes:
      - "./jaeger-ui.json:/etc/jaeger/jaeger-ui.json"
    command: --query.ui-config /etc/jaeger/jaeger-ui.json
    environment:
      - METRICS_STORAGE_TYPE=prometheus
      - PROMETHEUS_SERVER_URL=http://prometheus:9090
      - PROMETHEUS_QUERY_SUPPORT_SPANMETRICS_CONNECTOR=${PROMETHEUS_QUERY_SUPPORT_SPANMETRICS_CONNECTOR:-true}
      - PROMETHEUS_QUERY_NAMESPACE=${PROMETHEUS_QUERY_NAMESPACE:-}
      - PROMETHEUS_QUERY_DURATION_UNIT=${PROMETHEUS_QUERY_DURATION_UNIT:-}
      - PROMETHEUS_QUERY_NORMALIZE_CALLS=true
      - PROMETHEUS_QUERY_NORMALIZE_DURATION=true
    ports:
      - "16686:16686"
      - "4317:4317"
networks:
  backend:
- version: This is the Docker Compose version, which defines the syntax and available features in the file.
- services: These represent the containers you want to create, in this case, "jaeger."
- jaeger: This service uses the
jaegertracing/all-in-oneimage, a solution for distributed monitoring and tracing. - networks: Networks enable communication between containers, in this case, the Jaeger service is connected to the backend network.
- image: Specifies the Docker image to be used for the container.
jaegertracing/all-in-one:${JAEGER_IMAGE_TAG:-latest}:uses an image that enables distributed tracing. The image tag is defined by theJAEGER_IMAGE_TAGvariable, orlatestif not set. - volumes: Volumes allow data persistence beyond the container lifecycle. It mounts the
./jaeger-ui.jsonfile in the container at/etc/jaeger/jaeger-ui.json, allowing Jaeger to use a custom interface configuration. - command:
--query.ui-config /etc/jaeger/jaeger-ui.json:Configures Jaeger to use the specified configuration file for the user interface. - environment: Defines environment variables for the container, essential for application configuration.
- ports: Maps the container port to the host port; adjust the ports as necessary to avoid conflicts with other running services.
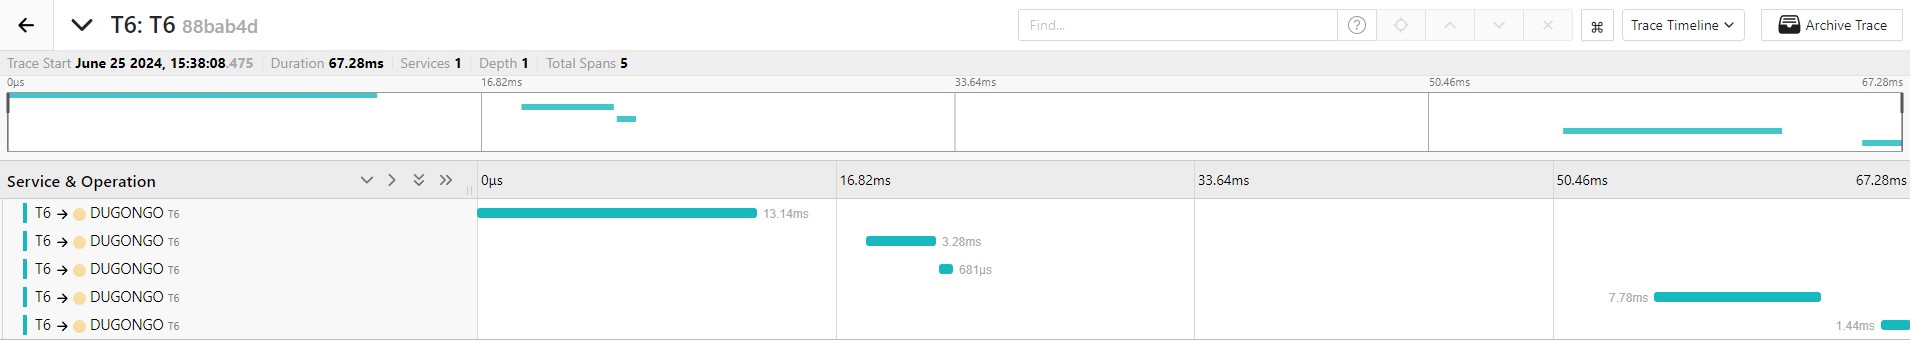
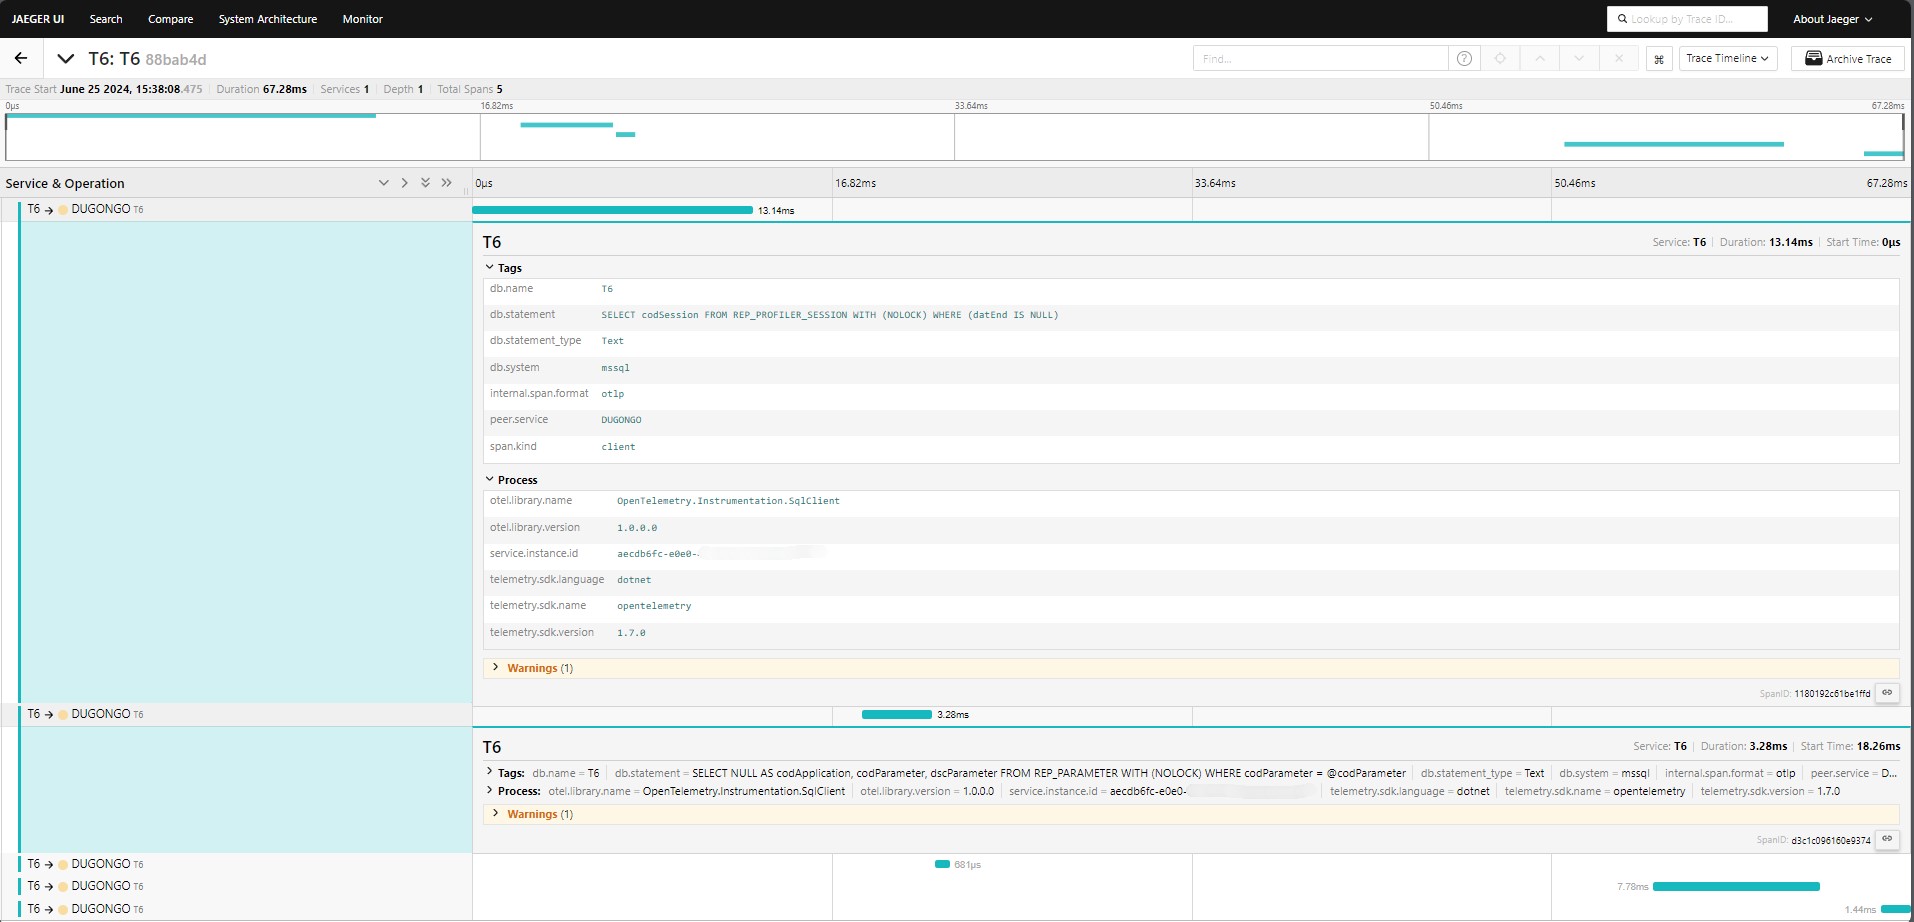
On the Jaeger screen, we can see all the traces being executed in the application and the execution time of each one.
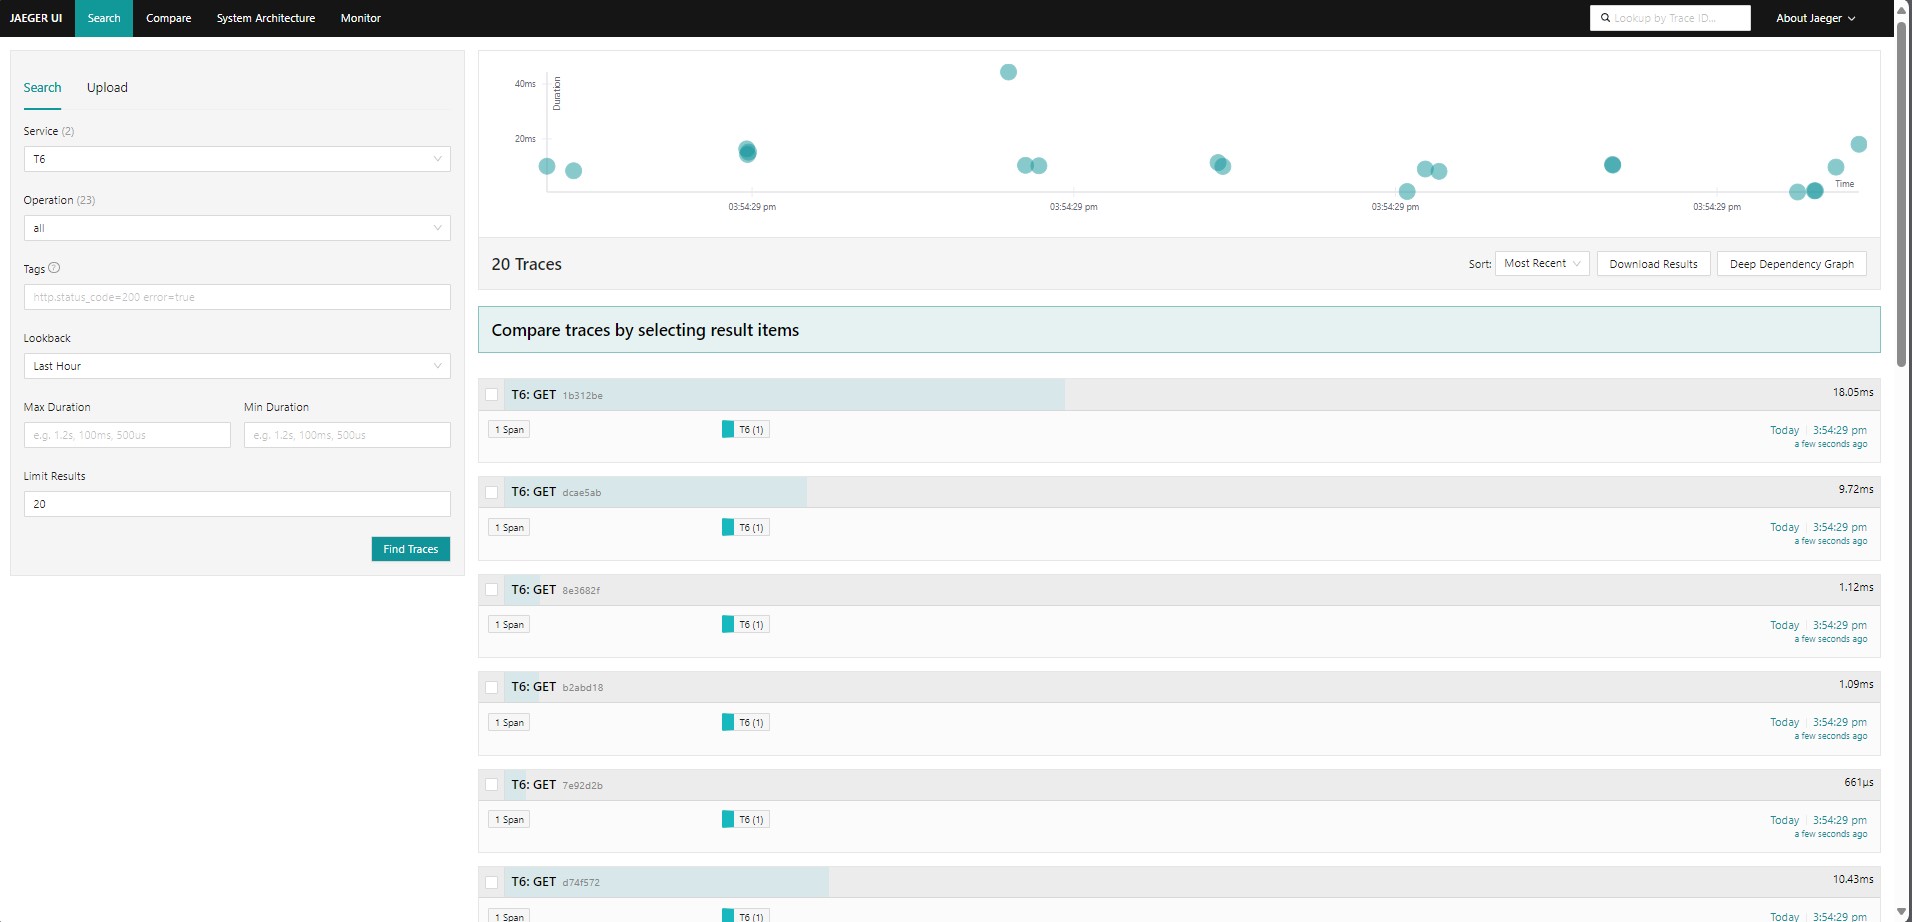
We can compare traces and display the details of each one, showing the execution date and time, the total duration of all requests, the number of services, the depth level, spans and their tags, processes, and the duration of each request. See the examples below: