¶ 1. Overview.
A dashboard is a visual tool used in an intuitive and accessible way. A dashboard integrates data from multiple sources into a single control panel, allowing users to monitor and analyze the performance of processes and operations in real-time without needing to navigate multiple paths to reach the desired location. It is essential for decision-making, providing charts, tables, reports, notes, tasks, and other visual elements that facilitate the quick interpretation of large volumes of data. Dashboards can be customized to meet the specific needs of different users.
¶ 1.1. Prerequisites.
¶ User Permissions.
We will need to configure some user permissions as system prerequisites to enable the creation of the dashboard in T6.
- In users, we will select the user and click on Permissions.
- A side panel will be displayed, and we will click on Functionalities.
- In the Functionalities tab, select the desired application.
- In User Resources, under the Manager option, click on
 to expand the options.
 - In Manager, we need to give the user the following permissions:
User permissions can also be applied to a group of users.
¶ 2. Application.
The application of a dashboard encompasses various areas, providing significant benefits in terms of data management and analysis. Used in corporate environments, in sectors such as IT, marketing, finance, human resources, sales, among others, where the intuitive visualization of complex data is crucial for the efficiency and effectiveness of operations. With the ability to integrate data from multiple sources, dashboards become indispensable tools for organizing data, files, tasks, and notes, aiming to improve transparency, accountability, and agility.
¶ 3. Usage.
Primarily used to display on the home screen of T6 Enterprise, shortcut panels aim to assist in the dynamic visualization of data and facilitate access to files, tasks, reports, and notes, without the need to navigate through multiple pages within the system.
¶ 3.1. Ribbon on the Dashboard.
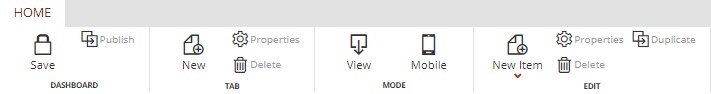
- Dashboard.
- Save: Any change or addition of frames made to the dashboard is only applied by clicking the save button. If you close the dashboard without saving, all changes will be lost!
- Publish: In publish, we can select specific users to whom we want to assign the dashboard by clicking on
 and selecting the desired users, or we can set the dashboard for all users by clicking on the switch button, which will be deactivated
  . We will activate it
  and click on
  .
.
If you select the all users option, and a user already has a specific dashboard, the specific dashboard will be retained for that user.
- Tabulation.
- New: Allows creating a new blank dashboard tab.
- Properties: Opens the side panel and allows changing the name of the newly created tab.
- Delete: Deletes the open dashboard tab.
T6 allows the creation of multiple tabs within the dashboard, facilitating the separation, visualization, and access to different resources with just one click.
- Mode.
- View: Displays a preview of how the dashboard will appear when opened by the user on the desktop version, without options to change size, position, or edit.
- Mobile: Displays a preview of the dashboard being used on a mobile platform, allowing you to change the arrangement of the items and frames created, adjusting them for better viewing on mobile devices!
- Edit.
- New Item: Creates a frame with items for quick viewing. The available items include Content, Explorer, Notes, Report, and Tasks.
- Properties: Within properties, we have global properties, which are the same for all items: changing the header display (yes or no), background color display (yes or no), changing the frame title, changing the display position on the screen by adjusting the top offset and left offset, and change the size of the frame by modifying its width and height. The height has two types, Unit and Automatic (when automatic is selected, it will not be possible to manually change the height of the frame). We also have specific properties for each item, which will vary depending on the item created.
- Delete: Removes a created frame from the dashboard screen.
- Duplicate: Creates an identical copy of the selected frame.
¶ 3.2. Creating a Dashboard.
To create a new dashboard, we will go to the side menu, in the explorer section. Click on New Item and in the Content option, select Dashboard.
When opening the dashboard, we will create new frames with items that will function as shortcuts within the system. The available frame options include Content, Explorer, Notes, Report, and Tasks.
The size and position of the frame can be changed using the mouse. To move it, simply click on the frame and drag it to the desired location. To change its size, position the cursor on the edge of the frame and drag until it is the ideal size. When dragging the frame, a dotted line will appear, outlining the final display size of the frame.
¶ 3.2.1 Content
The content frame within the dashboard will list the available options in the CMS table, which should only contain objects of type DataForm and DataFormDynamic.
When adding a Content panel, it will initially be displayed blank. We will select it and click on properties, a side panel will open. We will go to Content and select which file we want to display. However, the file names will be displayed by default as DataForm_ (view only) or DataFormDynamic_ (allows viewing and editing through the dashboard), followed by the code displayed in Explorer, for example:

Identify the code, select the object (in this case DataForm_311 or DataFormDynamic_311) and click Save. When opening the dashboard, if you have selected a DataFormDynamic, the following options will be displayed in the panel:
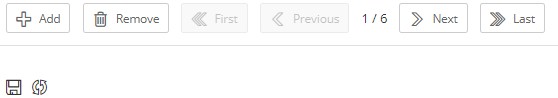
- Add: Allows adding a new data page within the dashboard. Upon clicking, you will be prompted to fill in the data, and a new page will be created when saved.
- Remove: Deletes a data page within the dashboard. Upon clicking, a message confirming the action will be displayed.
- First: Displays the first data page within the dashboard panel.
- Previous and Next: Allows navigation between the pages of the panel.
- Last: Displays the last data page within the dashboard panel.
- Save: Saves the changes applied to the data in the open form on the panel.
- Refresh: Click refresh if you have added some data that you do not wish to save, and the form will return to its original state.
When adding an object to the content frame in the dashboard, the viewing mode will always be in panel format, regardless of the viewing mode defined in the object.
¶ 3.2.2 Explorer
When selecting Explorer, the Recent folder will be displayed by default, showing the last 10 files opened by the user within the system. Upon selecting the frame and clicking on properties, a side panel with the item's properties will open. In the Explorer option, we will select the folder to be displayed in the frame (favorites, recent, or Sysphera). Within the Sysphera folder, it is possible to select the entire group of folders or a specific application. We can also change the view mode, which is set to list by default (showing type, name, and last execution date). We can change it to block view mode, which will display the items as thumbnails (showing only the icon thumbnail and the file name).
To facilitate user navigation, we use breadcrumb, which displays a linear navigation trail, generating links for each destination accessed, from the initial destination to the current destination. Each accessed destination functions as a link that, when clicked, quickly returns the user to any previous destination, improving the usability and efficiency of navigation. If the breadcrumb exceeds the frame limit, ellipses (...) will appear, and when hovering the cursor over the breadcrumb, a tooltip with the entire navigation trail will be displayed.
Within the frames, we have three shortcuts in the upper right corner. To open properties, click on
. To expand the frame to the screen limit, click on
. To restore it, click on
, and to delete the frame, just click on
.
¶ 3.2.3 Notes
When creating a notes frame, the notifications unread by the user related to the Workflow BPM will be displayed (visit our help center for more information about the Workflow).
¶ 3.2.4 Report
Creating a report frame in the dashboard allows the display of a pre-determined report when opening the home of T6. Within properties, we have:
- Report Properties: We will select the report to be displayed on the dashboard by clicking on , in the Report Name option, and select the report to be displayed.
- Transparent Background: We have a switch button to enable and disable the property.
- We have the Detailing property, in which we can select a report to be displayed from the previously selected report frame, eliminating the need to create another frame on the dashboard. Click on to expand the options and select the report that can be displayed.
- When selecting a detailing report, two other properties will be displayed: Allow maximizing and detailing the report in the current window with a switch button, which, when enabled, allows the detailing report to be viewed without the need to switch the T6 tab. By clicking on
 , the main report will be overlaid by the detailing report, which will be displayed maximized in the same dashboard tab.
 - And the property Open detailing in a new window with a switch button, which, when enabled, allows the detailing report to be viewed by creating another tab in T6 to display it. By clicking on
 , the detailing report will open in another tab, keeping the dashboard tab open.
- When selecting a detailing report, two other properties will be displayed: Allow maximizing and detailing the report in the current window with a switch button, which, when enabled, allows the detailing report to be viewed without the need to switch the T6 tab. By clicking on
- Enable parameters: It has a switch button, and when enabled, if the selected report supports parameter insertion, it will allow parameter insertion through the dashboard frame. Enabling the switch button will display a new property.
- Initial state of parameters: We can enable it so that when the report is opened, the parameter insertion tab is automatically displayed, or leave it disabled so that when the report frame is opened, the parameters tab needs to be expanded.
- Enable toolbar: Also with a switch button, when enabled, if the report supports such an action, the following toolbar will be displayed in the report:

When hovering the cursor over any of the toolbar functions, the action that the function performs will be displayed.
¶ 3.2.5 Tasks
- Tasks: When creating a task frame within the dashboard, all tasks assigned to the user created through the Workflow will be displayed, allowing for quick and dynamic viewing and access to the tasks. Within the properties, in options, we can select what will be displayed in the tasks added to the panel. We have the options Application, Scenario, Entity, Duration, and Deadline, and by default, all of them will be checked for display. If you do not want to view some of the items, you can uncheck the options by clicking the switch button, changing from activated:
 , to deactivated:
  . Finally, we can select the number of tasks that will be displayed on the panel, by default, 10 tasks are displayed.
¶ 4. Q&A
Frequently Asked Questions
1. What is a dashboard in T6?
A dashboard in T6 is a visual tool that integrates data from multiple sources into a single control panel, enabling real-time monitoring and analysis of processes while providing quick access to charts, tables, reports, notes, and tasks.
2. What is the main purpose of the dashboard?
The main purpose of the dashboard is to provide quick access to files, tasks, reports, and notes without navigating through multiple pages, acting as shortcuts on the T6 Enterprise home screen.
3. What permissions are required to create dashboards?
To create dashboards in T6, the user must have the Manager functionality with Create and view dashboards/maps enabled.
4. How do I create a new dashboard?
To create a new dashboard in T6, follow these steps:
- In the T6 Main Menu, open Explorer;
- Even though the dashboard is displayed on the T6 home screen, it must be created through Explorer.
- Click New Item;
- Select Content;
- Choose Dashboard;
- Open the created object to begin dashboard configuration.
- Use the Ribbon to add frames and configure the dashboard according to your needs.
- Finally, click Save to apply all dashboard changes.
5. What frame types can I add to the dashboard?
During dashboard creation, you can add the following frame types:
Content;
Explorer;
Notes;
Report;
Tasks.
6. Can I create tabs in the dashboard?
Yes, T6 allows you to create multiple tabs while editing the dashboard using the New option in the Tabulation section of the ribbon.
7. What happens if I do not save dashboard changes?
If changes are made to the dashboard and it is closed without saving, all changes are lost. It is essential to click Save to apply the changes.
8. How can I publish a dashboard for other users?
To publish a dashboard and make it available to other users, click Publish on the ribbon. A side panel will open where you can select specific users or enable the switch for all users.
9. What is the difference between "DataForm" and "DataFormDynamic" in the Dashboard Content frame?
The difference is in data editing capability:
DataForm: allows data viewing only, without editing through the dashboard.
DataFormDynamic: allows viewing and editing data through the dashboard.
10. What is displayed by default in the Dashboard Explorer frame?
By default, the Explorer frame displays the Recent folder with the last 10 files opened by the user, but this folder can be changed in the frame properties.
11. How many tasks are displayed by default in the Dashboard Tasks frame?
By default, 10 tasks are displayed in the Dashboard Tasks frame, but this number can be changed in the frame properties.
12. How can I change frame size and position in the dashboard?
To adjust frame size and position, use the mouse to drag frames and resize them, or configure the properties by changing top offset, left offset, width, and height.
13. How can I customize the Explorer frame display in the dashboard?
While editing the dashboard, in frame properties, users can choose between list mode or block mode, and select which folder to display (Favorites, Recent, or Sysphera).
14. What does the toolbar do in Dashboard reports and how can I display it?
It provides additional tools to manipulate the report while it is used in the dashboard.
To display it, enable the Enable toolbar option in the report frame properties. If you want the toolbar initial state to be visible, enable the Initial Toolbar State option.