¶ 1. Overview
The Data Table Creation feature allows you to structure and store data that will be used in forms, analyses, and integrations within T6. This tool is flexible and adaptable to different use cases, ranging from manual column creation to using SQL queries and tables that already exist in the database.
The creation process is guided by steps that include defining table properties, configuring columns, and, optionally, establishing relationships with other data sources. The selected creation type (Create, Table, or Query) determines the configuration flow and resources available for the object.
To use the new Data Table creation mode, you must enable the New Edit Data Table feature in the Preview panel, under Settings in the T6 main menu.
¶ 1.1. Prerequisites
To create, edit, and view data tables, the user must have the following Manager Feature enabled in Permissions:
The user must also be associated with a global group with the following Manager Features enabled:
¶ 2. Features
Among the Data Table features in T6, the following stand out:
- Data Table creation from three types: Create, Table, or Query.
- Manual addition of columns with different data types (Text, Date, Decimal, User, etc.).
- Relationship configuration with other Data Tables, Dimensions, or Users.
- Option to use an existing Data Table as a template.
- Definition of properties such as name, description, creation type, storage, and auditing.
- Step-by-step guided interface to simplify configuration.
- Database and SQL query integration (type Query).
¶ 3. Usability
To switch the Data Table creation mode to the new user interface, go to the T6 main menu and, in the Settings section, select Preview.
With the Preview panel open, enable the New Edit Data Table option. Then just close the panel and refresh the page.
1. Open Explorer and select where the Data Table will be created.
2. In the ribbon, select New Item and, under Data Entry, click Data Table.
3. Select the created object and open it with a double click or, in the ribbon, click Open.
- When opening the object, a side panel will be displayed where the Data Table creation settings are configured.
Fields marked with * are required!
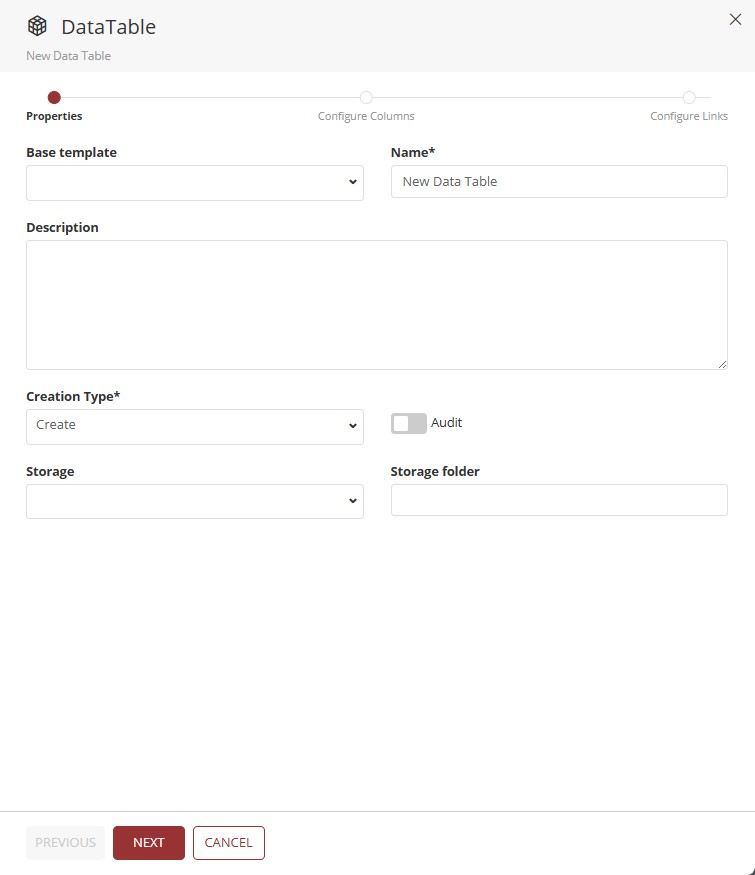
Data Table creation is divided into a few steps. The first one, Properties, has the following fields:
- Base template: Through a dropdown, you can select a Data Table already created in the system to use as a base.
- Name*: Name defined for the object.
- Description: Optional field where you can enter a description for the object.
- Creation Type*: Dropdown with the options: Create, Table, and Query.
- Auditing: Switch button. When enabled, allows object auditing.
- Storage: Dropdown with available storage options for selection. (For more information, visit: T6 Help Center - Storage).
- Storage folder: If a name is defined, a new folder will be created inside the container in Azure Portal to store uploaded files. If left blank, files will be saved directly in the container.
The selected Creation Type will define the next Data Table configuration steps.
¶ 3.1. Creation Type: Create
1. After completing the Properties step, click Next.
- After clicking Next, you will be directed to the Configure Columns step.
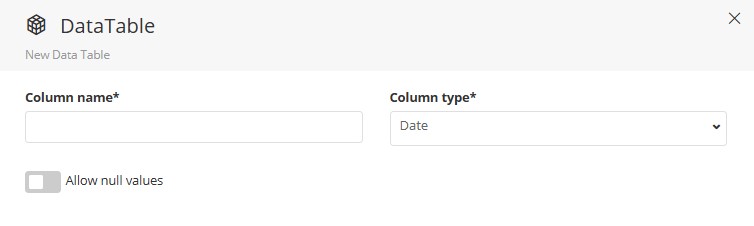
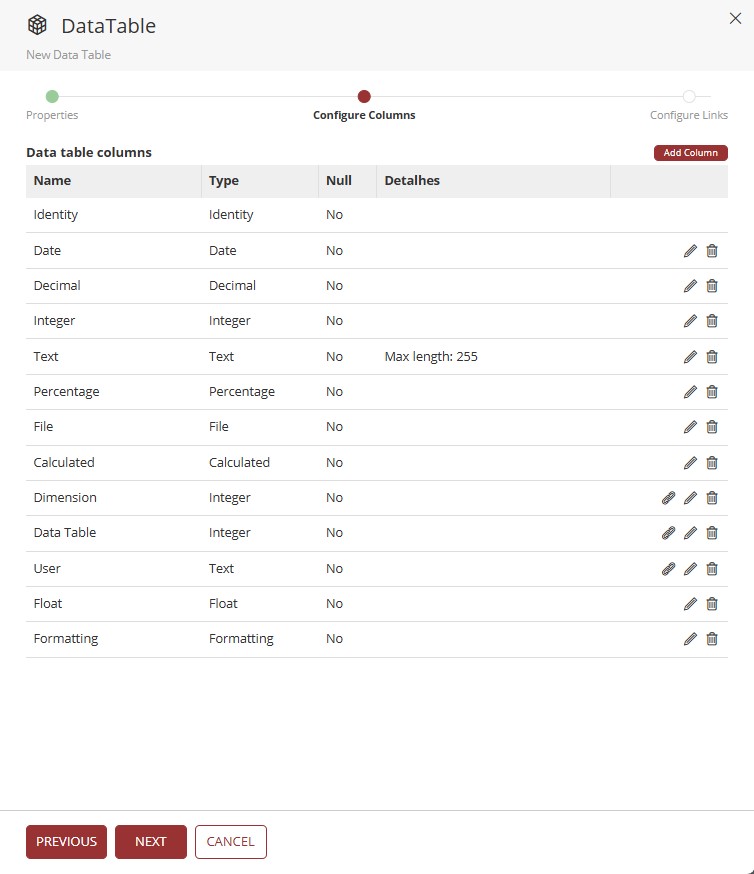
In the Configure Columns step, initially only the Identity column will be shown. To add new columns, click Add Column. The fields to fill in are:
- Column Name*: Name of the column to be created.
- Allow null values: Switch button. When enabled, forms using this column can be saved even without input.
- Column Type*: Dropdown with the following data type options:
Column Type
| Option | Description |
|---|---|
| Date | Displays a dropdown with a date-picker for selecting a date; |
| Decimal | Accepts numeric values with mandatory decimal places; |
| Integer | Accepts integer numeric values, not allowing decimals; |
| Text | Accepts text data, with a defined maximum number of characters; |
| Percentage | Accepts numeric values with decimal places and a fixed percentage operator; |
| File | Allows file upload in the following formats: .gif, .jpeg, .jpg, .png, .xml, .pdf, .doc, .docx, .txt, .csv, .xls, .xlsx; |
| Calculated | Accepts data from calculation. Requires filling in the Expression* field; |
| Dimension | Allows selecting members from a dimension. Requires filling in Application* and Dimension*; |
| Data Table | Selection of another existing Data Table; |
| User | Displays a dropdown for selecting a system user; |
| Real | Accepts floating-point numeric values, with no mandatory decimal places; |
| Formatting | Allows changing spreadsheet properties: Number, Alignment, Font, Border, Background, Size, Order, Level, and Indent. |
¶ 3.1.1. Types with Additional Settings
Some column types display extra configuration fields when selected. See the details for each below:
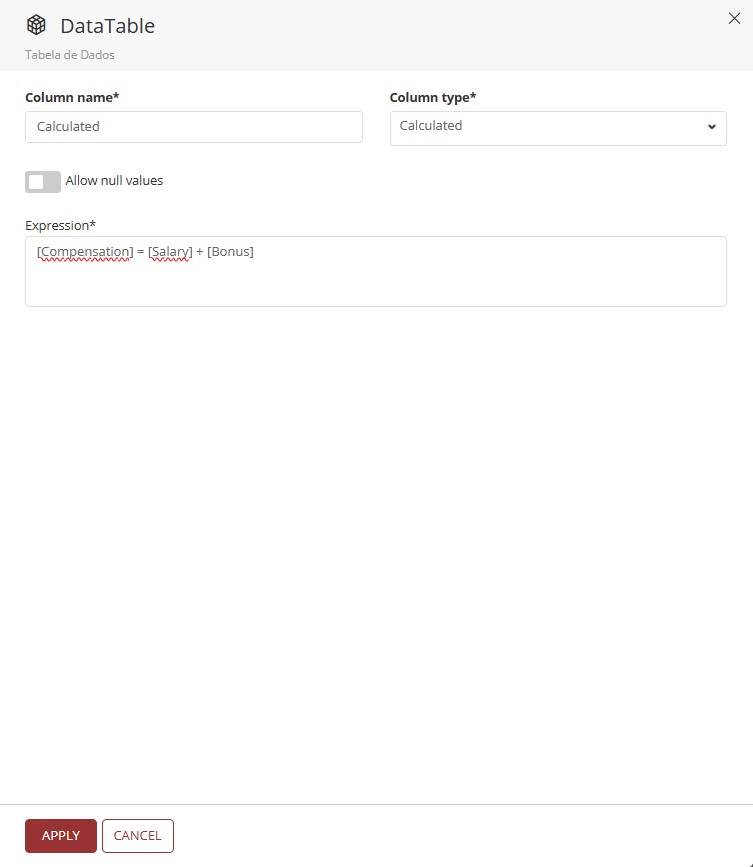
¶ Calculated
When the Calculated type is selected, the Expression* field appears — a text area where the calculation expression must be entered. Supports arithmetic operators (+, -, *, /) and Functions available in T6.
¶ Dimension
When the Dimension type is selected, two additional required fields appear:
- Application*: Dropdown listing all available applications in the system. Selecting an application is required to load the dimensions in the next field.
- Dimension*: Dropdown dynamically populated with the dimensions of the selected application.
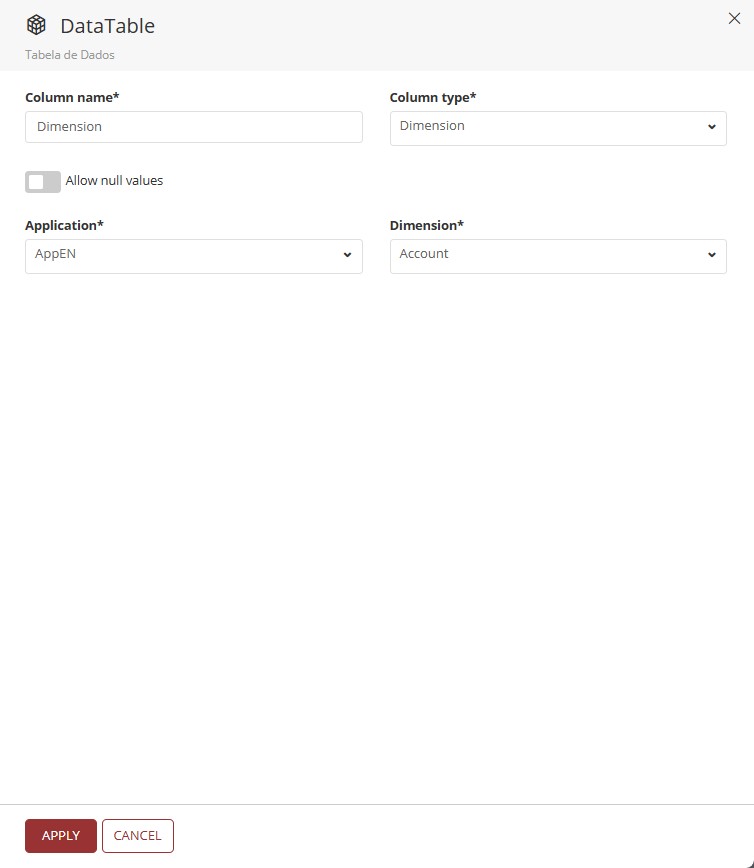
Adding a Dimension column automatically creates a relationship in the Configure Relationships step.
¶ Data Table
When the Data Table type is selected, the Data Table* field appears — a dropdown listing all available data tables in the system. The selected table will be the reference data source for this column.
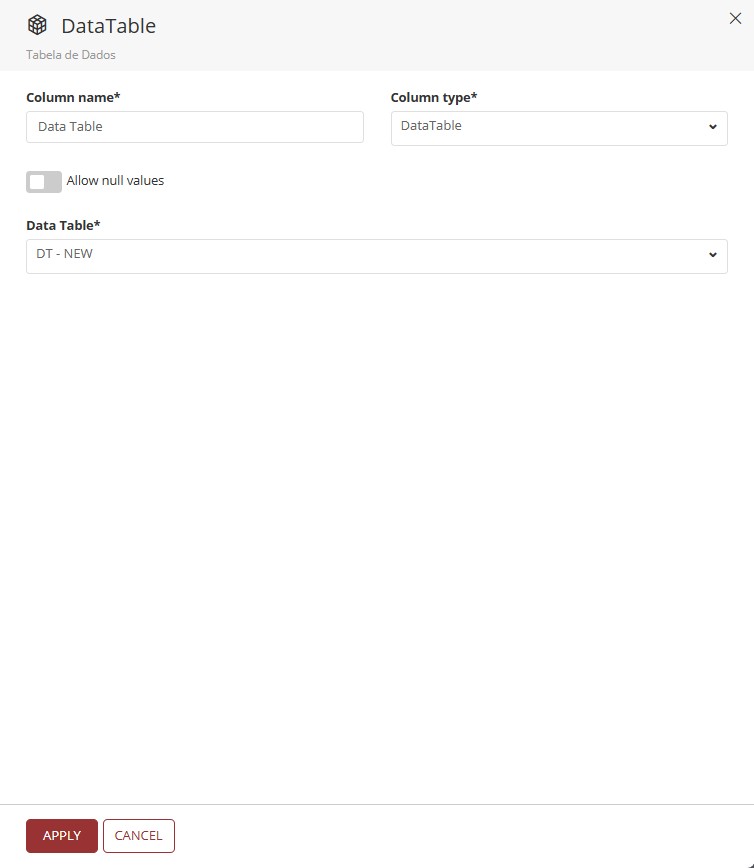
Adding a Data Table column automatically creates a relationship in the Configure Relationships step.
¶ User
The User type does not display additional configuration fields. Once selected, simply define the column name and click Apply. The system will automatically use the user table as the reference data source.
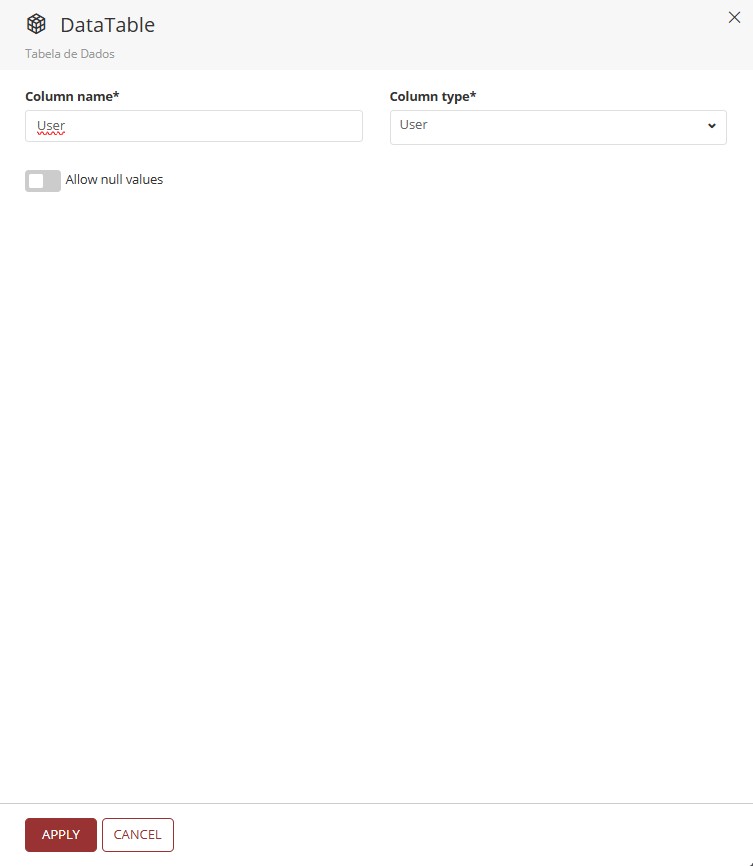
Adding a User column automatically creates a relationship in the Configure Relationships step.
After filling in the column name and type, click Apply. The column will be added to the list and you can repeat the process for as many columns as needed.
2. After finishing the addition of columns, click Next.
In the previous step, if you added any column of type Data Table, Dimension, or User, the relationship will already have been created and displayed in the Configure Relationships step.
Click Confirm to add the link.
3. Finish by clicking Done.
¶ 3.2. Creation Type: Table
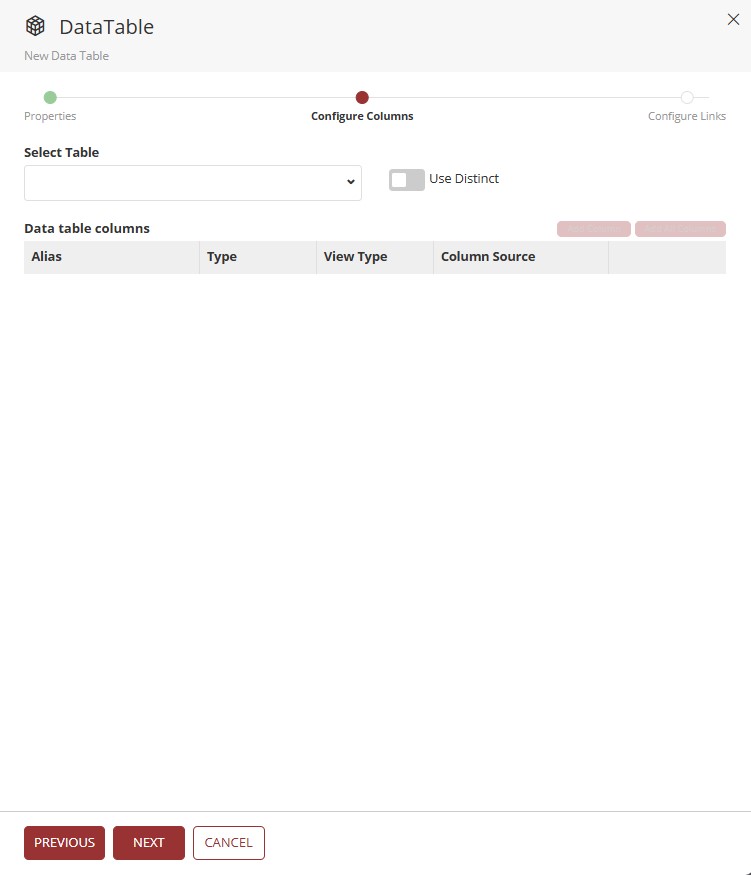
1. After filling in the Properties step, click Next.
- You will be directed to the Configure Columns step.
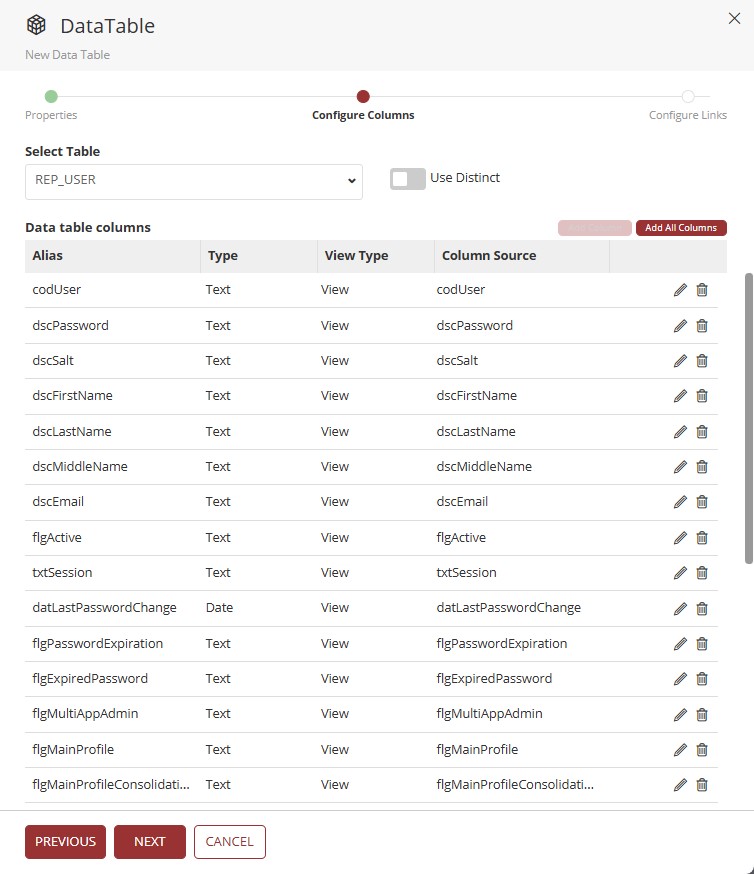
In this step:
- Initially, no columns will be displayed.
- Use the dropdown Select a Table to choose a table directly from the database.
- Use the Distinct Values switch button if needed.
Distinct Values: When enabled, this makes each occurrence of a specific value unique in the table being created, hiding possible duplicate values from the related table. A unique value is defined by the combination of all columns. Therefore, if there is a column with unique values, such as
ID, the "Distinct Values" flag will not work.
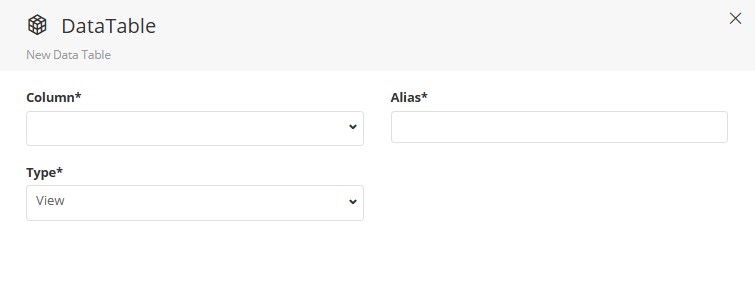
- Add columns individually by clicking Add Column. You must fill in: Column*, Alias* (name shown in the header), and Type*.
Column Type
| Option | Description | Example |
|---|---|---|
| View | Displays values exactly as they are stored in the selected data table; | 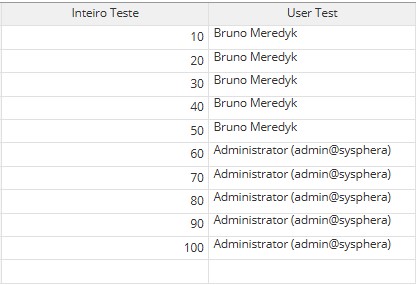 ↓ 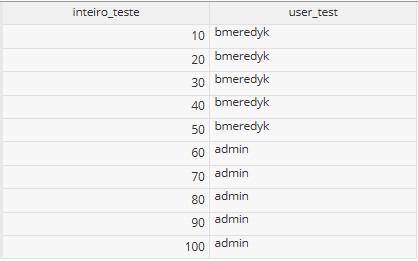 |
| Minimum | Displays only the lowest numeric value associated with a given context, hiding the remaining values; | ↓ 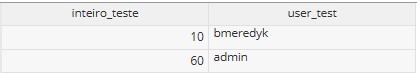 |
| Maximum | Displays only the highest numeric value associated with a given context, hiding the remaining values; | ↓ 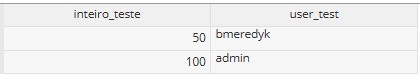 |
| Sum | Performs the sum of all numeric values in a given context and displays only the total; | ↓ 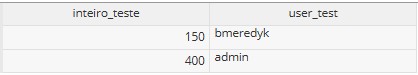 |
| Average | Calculates all numeric values in a given context and displays only the average among them; | ↓ 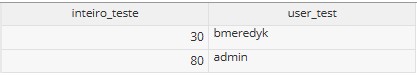 |
| Count | Checks the contexts in the table and displays the total number of existing records for each context; | 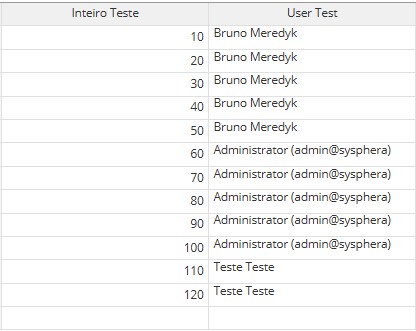 ↓ 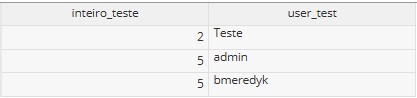 |
Except for the View type, the column types above are applied only to columns of types Decimal, Integer, Percentage, and Real;
If you prefer, click Add all Columns to import all columns from the selected table, and then edit or delete them.
When clicking Add all columns, by default the column type will be set to View.
2. After finishing column selection, click Next.
In the previous step, if you added any column of type Data Table, Dimension, or User, the relationship will already have been created and displayed in the Configure Relationships step.
3. Click Confirm to add the link.
4. Finish by clicking Done.
¶ 3.3. Creation Type: Query
1. After filling in the Properties step, click Next.
- You will be directed to the Configure Columns step.
In this step:
- Initially, there will be no columns.
- Add columns through the Define Query field by writing an SQL instruction directly in the database.
- It is possible to add columns individually with Add Column (fields: Column*, Alias*, and Type*).
- Or import all columns returned by the query with Add all Columns, and edit them as needed.
2. Click Next after configuring the columns.
In the previous step, if you added any column of type Data Table, Dimension, or User, the relationship will already have been created and displayed in the Configure Relationships step.
3. Click Confirm to add the link.
4. Finish by clicking Done.
The display of columns selected through a Data Table will be done through the relationship between a Data Form and the created Data Table.
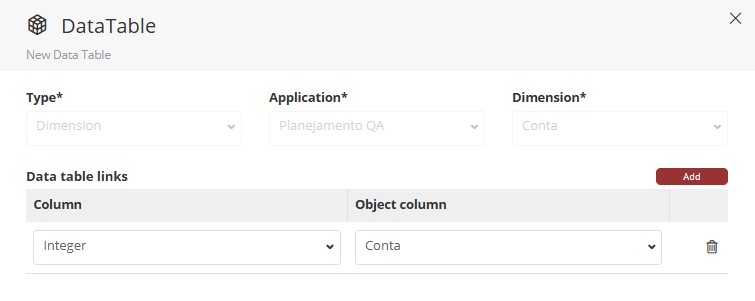
¶ 4. Relationship Configuration
In this step, a table with 2 columns is displayed: Object and Mapping.
-
Object: Displays the object name where data is stored and linked to a Data Table column for display. This field identifies the reference data source used in the relationship, which can be an existing data table, an OLAP system dimension, or the system users list.
-
Mapping: Displays the name defined for the column in the Data Table and is shown next to the related object. It represents the foreign key in the current table that establishes the link to the matching record in the destination table.
Each row shown in this table represents an existing relationship in this Data Table.
Click Add to create a new link manually.
A modal will open asking you to select the relationship Type*. Choose one of the three available options: Data Table, Dimension, or Users.
Each type offers different mapping and configuration methods, with specific behavior.
¶ Data Table
This relationship type allows connecting the current table to another data table already existing in the system.

When Data Table is selected, a dropdown appears listing all data tables available in the system. Select the table that will be used as the relationship data source.
Self-referential relationships: If you need to relate a column to the same table itself (for example, to build hierarchies where one record has a "parent" in the same table), save the data table without the relationship first, then reopen it for editing, advance to the relationship configuration step, and select the same data table.
¶ Dimension
This type connects the table with application dimensions, enabling integration with hierarchical structures already defined in the system.

When Dimension is selected, two additional fields become required:
- Application: Dropdown with all applications available in the system.
- Dimension: Dropdown dynamically populated with dimensions available in the selected application.
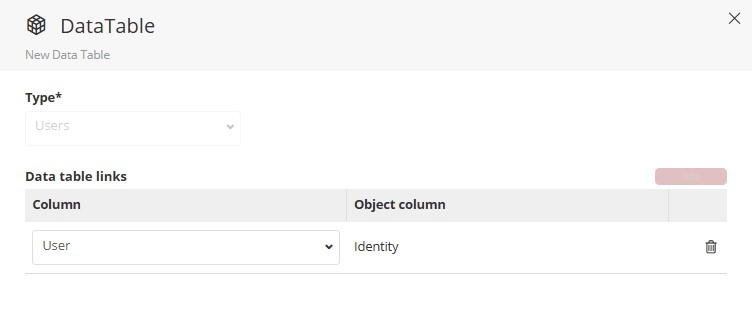
¶ Users
This type links table records to specific system users.

The Users relationship does not require additional fields, since it automatically uses the system users table as the source.
¶ 4.1. Column Mapping
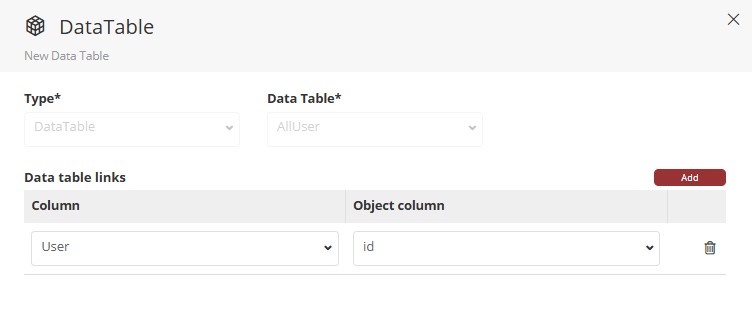
After selecting the relationship type, click Add. A new row will be created in the Data Table Links table, showing two fields for mapping configuration:
¶ Mapping Configuration:
-
Column: Dropdown to select the column in the current Data Table that will serve as the foreign key. This column stores the related record identifier.
-
Column in Object: Dropdown to select the matching column in the related table, dimension, or user that will serve as the primary key.
4. Click Confirm to add the link.
After confirmation, the relationship will be listed in the main table.
5. To finish relationship configuration, click Done.
¶ 5. Q&A
Frequently Asked Questions
1. How do I enable the new Data Table creation mode in T6?
To enable the new Data Table creation mode, follow these steps:
- Open the T6 main menu.
- Go to Settings.
- Select Preview.
- Enable the New Edit Data Table option.
- Close the panel and refresh the page.
2. What permissions are required to work with data tables?
To work with data tables in T6, the user must have the manager feature Manage the structure of data tables enabled, and must belong to a global group with Manage Explorer, Manage Data Tables, and Direct Data Access enabled.
3. When creating a data table, what is the difference between the "Create", "Table", and "Query" types?
The differences are:
Create: Lets you add columns manually with different data types.
Table: Uses an existing database table as a base.
Query: Uses custom SQL statements to define the data.
4. When should each creation type be used when creating a new data table?
When creating a new data table in T6, use:
Create for custom structures.
Table to reuse data already available in the database.
Query for complex needs that require custom SQL commands.
5. Which column types are available in the "Create" type of Data Tables?
The available column types in the Create type are:
Date;
Decimal;
Integer;
Text;
Percentage;
File;
Calculated;
Dimension;
Data Table;
User;
Real;
Formatting.
6. What does the "Distinct Values" option do in the "Table" type?
The Distinct Values option in the Table creation type removes duplicate values based on the combination of all columns.
Note: It does not work if there are columns with unique values such as ID.
7. Which file formats are accepted in columns of type "File" in a data table?
By default, the following formats are accepted:
.gif;
.jpeg;
.jpg;
.png;
.xml;
.pdf;
.doc;
.docx;
.txt;
.csv;
.xls;
.xlsx.
Users can restrict these formats through system parameters.
8. How do aggregation types (Minimum, Maximum, Sum, etc.) work in "Table"-type data tables?
Aggregation types work as follows:
View: Shows values as stored.
Minimum/Maximum: Shows only the lowest/highest numeric value.
Sum: Totals all numeric values.
Average: Calculates the average of values.
Count: Counts records by context.
9. In data table creation, how do you create relationships between tables?
After configuring the Properties step, in Configure Relationships, click Add and choose the type: Data Table, Dimension, or Users. Then map the matching columns.
10. In the "Configure Relationships" step, is it possible to relate a table to itself?
Yes, but you must save the data table first.
After saving the table, reopen it for editing and configure the relationship with the same table.
11. What is a "Base template" in data tables?
The Base template is an existing Data Table that can be used as a model to create a new one by copying its structure.
12. What is the purpose of the "Auditing" option in data tables?
When enabled, the Auditing option allows tracking changes and access to the data table (for more information, see: Auditing).
13. How do "Storage" and "Storage folder" work in data tables?
The Storage and Storage folder options define where files are saved in Azure. If a folder name is provided, it is created inside the container; if left blank, files are saved directly in the container (for more information, see: Storage).