¶ 1. Overview
T6 offers native integration with Power BI through an embedded service.
This feature allows you to create, view, and manage reports within T6, maintaining automatic synchronization between the two platforms.
The integration between T6 and Power BI ensures:
- Reports always synchronized between the platforms.
- Changes made in Power BI reflected in T6, and vice versa.
- Flexible configuration of reports by application.
With this integration, analytical data remains centralized and consistent, facilitating decision-making.
¶ 1.1. Prerequisites
To use Power BI reports in T6, you must have the following permissions:
-
Manager
-
Planner
¶ 2. Configuration
To configure the integration within T6, follow these steps:
- In the main T6 menu, under Settings, access Parameters.
- In Parameters, under the Global tab, expand the Integration options.
- For Power BI to work within T6, you must fill in the following parameters:
- Report - Client Secret.
- Report - ClientID.
- Report - GroupID.
- Enable the Report - Integration switch.
- Report - API Url.
- Report - Authorization Url.
- Report - Resource Url.
- Enable the Report - Use RLS switch.
The information required to fill in the parameters must be obtained directly from your system administrator. For more details, see: Power BI Integration with T6.
After filling in the parameters, you will be able to view the existing reports in the configured Power BI workspace.
To view the list of reports, access the Explorer, select the Integration tab, and click Reports:
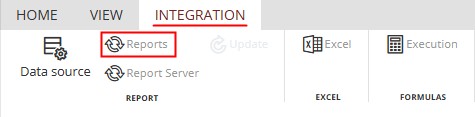
A side panel will open, displaying all reports available in the Power BI workspace configured in the parameters.
In this list, there will be a checkbox next to each report name:
- Active flag : Report exists in the Power BI workspace and is synchronized with T6.
- Inactive flag : Report exists in the Power BI workspace and is not synchronized with T6.
This integration is individual per application. Each application will have the same report list; the difference is the synchronization flag, allowing the same report to be synchronized with more than one application.
- You can select the application through a dropdown in the panel itself.
- You can also select the folder in which the report will be saved. By clicking the folder icon, the available folders for selection will be displayed.
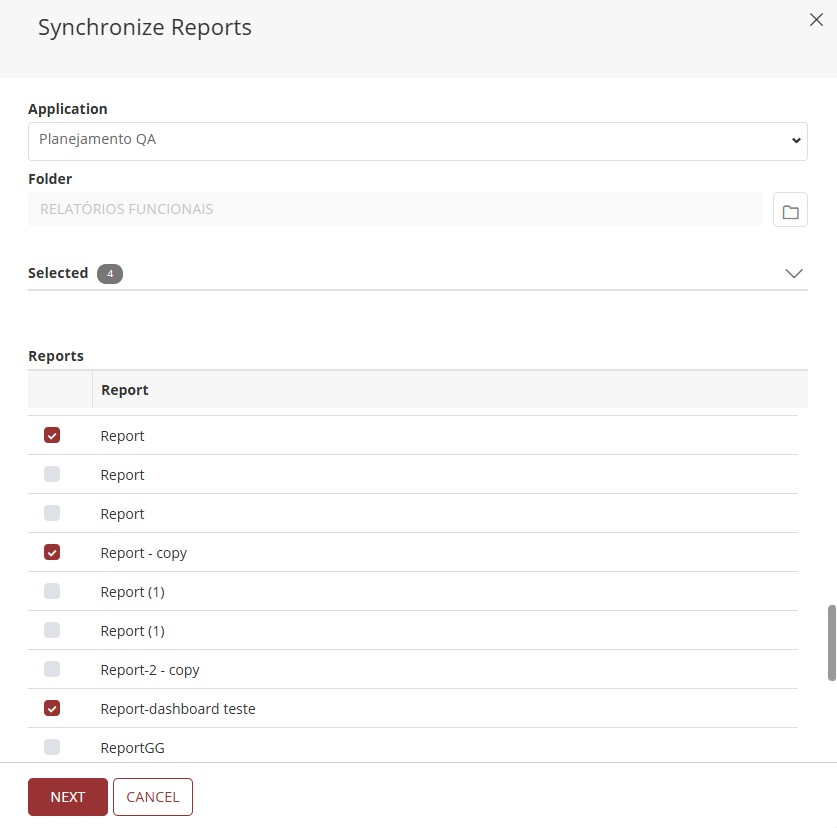
After selecting the reports in the list, by clicking Next, a summary of the actions that will be performed when clicking Save will be displayed.
Report synchronization is operated from the Integration tab in the Explorer. There, T6 compares the current state of the Power BI workspace with the internal report metadata and presents the pending actions before confirmation.
For details on actions such as Rename, Change ID, Change Dataset ID, safe removal, and API automation, see section 5. Report Synchronization.
Whenever an action involving reports (rename, delete, create, etc.) is performed, run synchronization from the Integration tab.
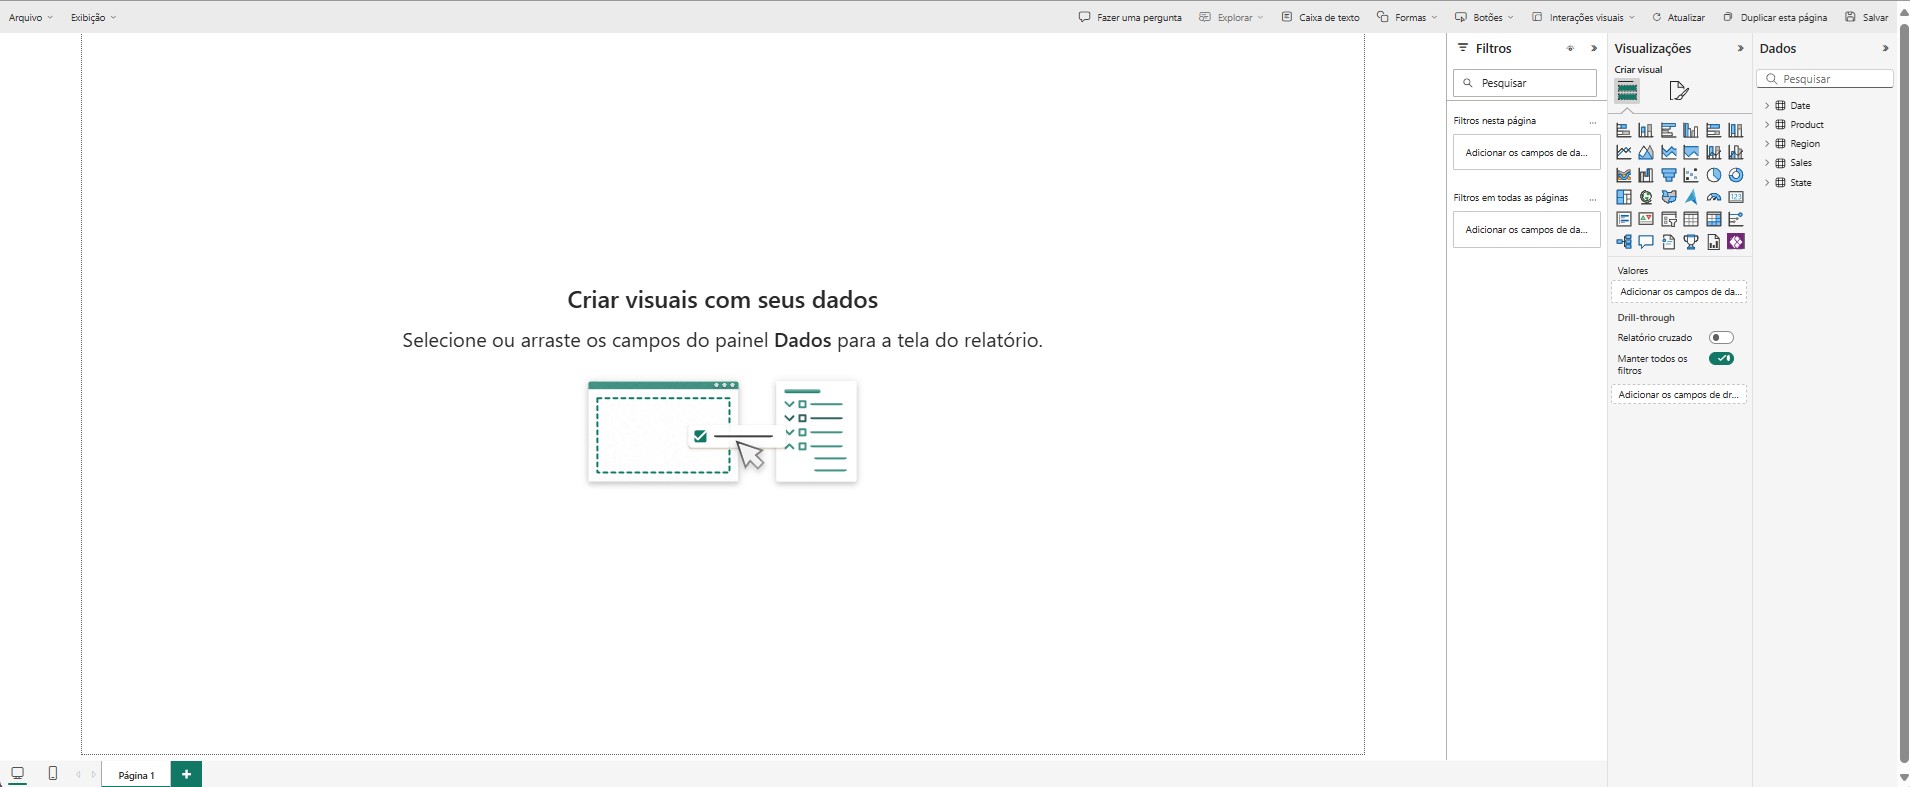
¶ 3. Creation
Creating a report through T6 will use the existing data from the datasets available in the previously configured Power BI workspace.
- In the main T6 menu, access the Explorer and select the Navigator option.
- After accessing the navigator, select the location to create the report.
- To create a Power BI report, in New Item on the ribbon, select the Report option.
For the object to be displayed, the page must be refreshed.
- Open the created object with a double-click or, in the ribbon, by selecting the Open option.
- A side panel will open, where you can select the desired Dataset.
- The displayed datasets will correspond to the Power BI workspace.
In the report editing section, we can perform the same actions as in the Power BI Service, since we work with a Power BI embedded within T6.
¶ 3.1. Report Area
Central space where visualizations are built. We can drag fields and visuals into this area and adjust their layout as needed to create interactive reports.
¶ 3.1.1. Visualizations Panel
Located to the right of the report area, this panel allows you to:
- Select types of visualizations (visual elements).
- Configure data fields for each visual.
- Customize visual properties, such as colors, titles, and interactions.
In the Visualizations Panel, the following visual elements are available to help display the data:
| Visual Elements | |||||
|---|---|---|---|---|---|
| Stacked Bar Chart | Stacked Column Chart | Clustered Bar Chart | Clustered Column Chart | 100% Stacked Bar Chart | 100% Stacked Column Chart |
| Line Chart | Area Chart | Stacked Area Chart | 100% Stacked Area Chart | Line and Stacked Column Chart | Line and Clustered Column Chart |
| Ribbon Chart | Waterfall Chart | Funnel | Scatter Chart | Pie Chart | Donut Chart |
| Treemap | Map | Filled Map | Azure Map | Gauge | Card |
| Multi-row Card | KPI | Slicer | Table | Matrix | Key Influencers |
| Decomposition Tree | Q & A | Smart Narrative | Goals (Preview) | Paginated Report | Power Apps for Power BI |
Visual elements depend on the data to be displayed, allowing you to select one or more items to interact with the visualization object, thus changing its display.
Filters can also be applied. Each visual object has different filtering options.
¶ 3.1.2. Filters Panel
Located next to the Visualizations and Data panels, this panel allows you to:
- Apply filters to specific visualizations, pages, or the entire report.
- Add fields to refine the displayed data.
- Configure interactions between filters and visuals.
Filtering can be applied in different ways: to a visual, to a specific page, or across all pages.
¶ 3.1.3. Data Panel
Also on the right, next to the Visualizations Panel, it displays:
- Tables and fields available in the data model.
- Allows dragging (or selecting) fields into the report area or into values, axes, and legends areas in visuals.
¶ 3.1.4. Page Navigation
At the bottom of the interface:
- Displays the existing pages in the report.
- Allows you to add new pages, rename, duplicate, or delete existing pages.
- Allows you to change the report viewing mode, including switching to mobile view.
¶ 3.2. Ribbon
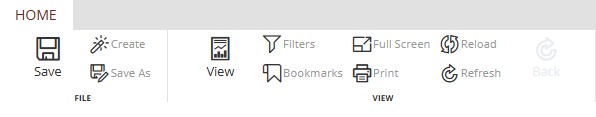
¶ 3.2.1. Save
Saves the report information within T6.
Every change made to a report within T6 is directly reflected in the Power BI environment. When saving a report generated via T6, it will be displayed in the Power BI workspace, as well as changes made within T6 to reports created directly in Power BI.
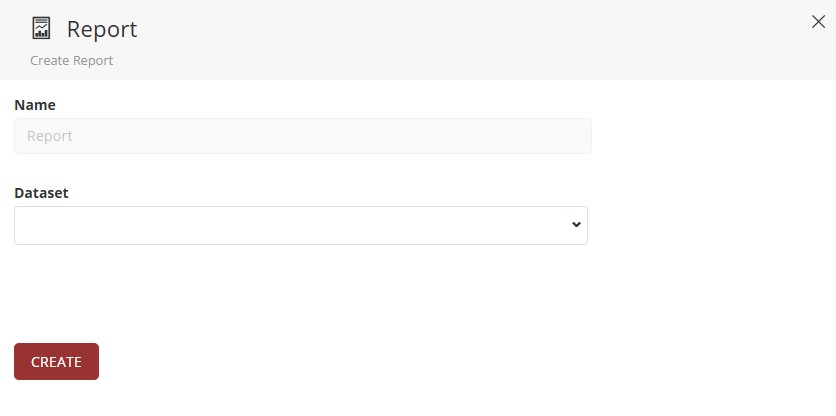
¶ 3.2.2. Create
Allows you to create a new report without the need to access another screen.
When clicking Create, a side panel will open where you can define the name and dataset of the new report. Click Save to open the editing page.
After completion, by accessing T6 Explorer or the Power BI workspace, you will be able to view the new report created.
Attention: Any unsaved changes in the current report will be lost when finishing the Create process.
¶ 3.2.3. Save As
Allows you to create an exact copy of the report in its current state without switching screens.
When clicking Save As, a side panel will open to enter the name of the new report. After clicking Save, the screen will refresh and the created copy will be displayed.
After completion, by accessing T6 Explorer or the Power BI workspace, you will be able to view the new report created.
Attention: Any unsaved changes in the current report will be lost when finishing the Save As process.
¶ 3.2.4. Edit/View
Edit/View: Button that allows us to switch between editing and viewing modes without the need to change screens or reload the page. In Edit mode we can make changes to the report, while in View mode we can only interact with the data already present in the report.

←→

¶ 3.2.5. Filters
Filtering through the Ribbon will only be possible if filtering options have been enabled in the report filter panel.
To filter the data, click Filters in the ribbon.
The following options are available: Basic Filtering and Advanced Filtering.
Basic Filtering:
A list with all items of the selected data will be displayed, allowing selection through a checkbox .
Only the selected items will be displayed in that dataset.
Advanced Filtering:
- Through filters, the user can apply compound filters with two criteria, connected by logical operators:
- And: both conditions must be true.
- Or: at least one condition must be true.
- Each filter field has:
- A comparison operator (e.g., “contains”, “does not contain”, "starts with", etc.);
- A value field to be filled based on the column’s data type.
Click to view the Operator Types
| Operator | Description |
|---|---|
| Contains | Returns records whose field value contains the specified character sequence in any position. |
| Does not contain | Returns records whose field value does not contain the specified character sequence in any position. |
| Starts with | Returns records whose field value starts exactly with the specified character sequence. |
| Does not start with | Returns records whose field value does not start with the specified character sequence. |
| Is | Returns records whose field value exactly matches the specified value. |
| Is not | Returns records whose field value is different from the specified value. |
| Is blank | Returns records whose field value is null (no information). |
| Is not blank | Returns records whose field value is not null. |
| Is empty | Returns records whose field value is an empty string. |
| Is not empty | Returns records whose field value is not an empty string. |
- By clicking Apply, the data will be displayed according to the applied filters.
¶ 3.2.6. Bookmarks
Displays a new panel in the report editing screen:
- Allows saving specific report states.
- Facilitates navigation between different visualizations and interactions.
¶ 3.2.7. Full Screen Mode
Available in the "View" tab, this option:
- Expands the report to occupy the entire screen.
- Ideal for presentations and real-time displays.
- To exit "full screen" mode, simply press ESC.
¶ 3.2.8. Print
Opens the report print screen, displaying only the added content.
¶ 3.2.9. Reload
Restores the report to its last saved state.
By clicking Reload, all unsaved changes will be lost.
¶ 3.2.10. Refresh
By clicking Refresh, the Power BI dataset will be checked for changes.
If there are new data, the form will be updated to reflect the values according to the Power BI workspace.
If there are no new data, the form will remain unchanged.
¶ 3.2.11. Export
The Export tool allows you to export and download reports in different ways and in different file formats.
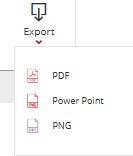
When clicking on Export, a dropdown will open for file format selection. The available options are: PDF, PPT, and PNG.
When selecting the file format, a window will be displayed to choose the export method with the following options:
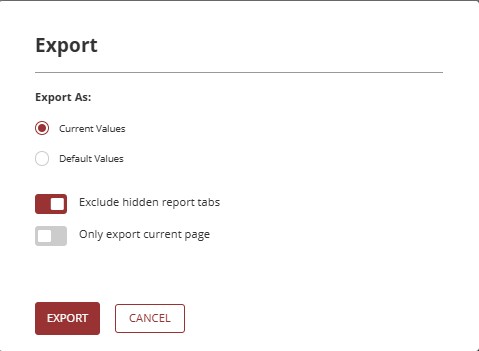
- Current Values: When selecting this option, the export will provide the data as currently being viewed. If filters were applied for visualization, they will be respected.
- Default Values: When selecting this option, the export will ignore the filters applied through T6, bringing the data as defined in the original report.
It is possible to select only one of the value types. When choosing one option, the other will be automatically disabled.
- Exclude hidden report tabs: A switch button that, when enabled, will export only the pages visible to the user. If disabled, it exports all pages, including the hidden pages present in the report.
- Export current page only: A switch button that, when enabled, will export only the page open at the time of export. If disabled, all pages in the report will be exported.
It is possible to enable only one of the switch buttons at a time. When enabling one of them, the other will be disabled. On the other hand, if necessary, both buttons can remain disabled.
When clicking Export, a notification will be generated in the system, allowing you to monitor the export progress.
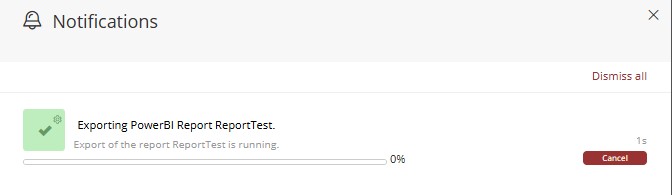
If you want to interrupt the report export, just click on
, the following notification will be displayed:
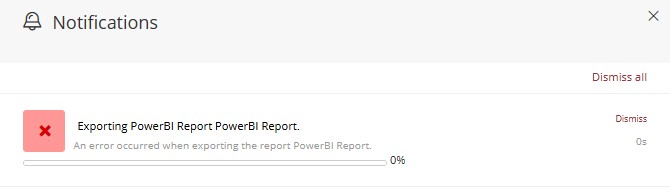
In case of success, the following notification will be displayed:
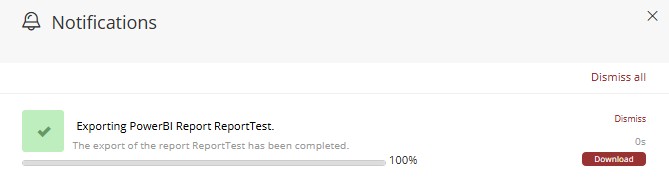
After completion, through the notification itself you can download the exported report by clicking on the

If you choose to export a multi-page report in
PNGformat, upon download, one file will be generated for each page. These files will be stored in a compressed folder (.zip) with the name of the exported report.
¶ 3.3. Removing a Report
It is possible to make a report stop being displayed in T6 without removing it from Power BI.
- Access the Integration tab in the ribbon and select the Report option.
- With the report list displayed, uncheck the box of the report you want to hide from T6 and click Next.
- Confirm the action to be performed and click Save.
It is important to perform this action if you want to remove a form from T6 but keep it in Power BI. If the deletion is made directly in T6, the report will also be removed from Power BI.
For the difference between Remove, Not found (Remove) and direct deletion in the Explorer, see section 5.4. Synchronization Actions Details.
¶ 4. Using RLS
To configure RLS in Power BI reports, it will be necessary to use Power BI Desktop.
In T6, we will need to create a data table linking the user (coduser) with a filter key (sk_cenario, sk_entidade, etc...) that will be used for the RLS configuration.
After creating the table, it will be necessary to create a data form pointing to the created table. We will need to add data to this form in order to use RLS.
¶ 4.1. Creating Relationships Between Tables
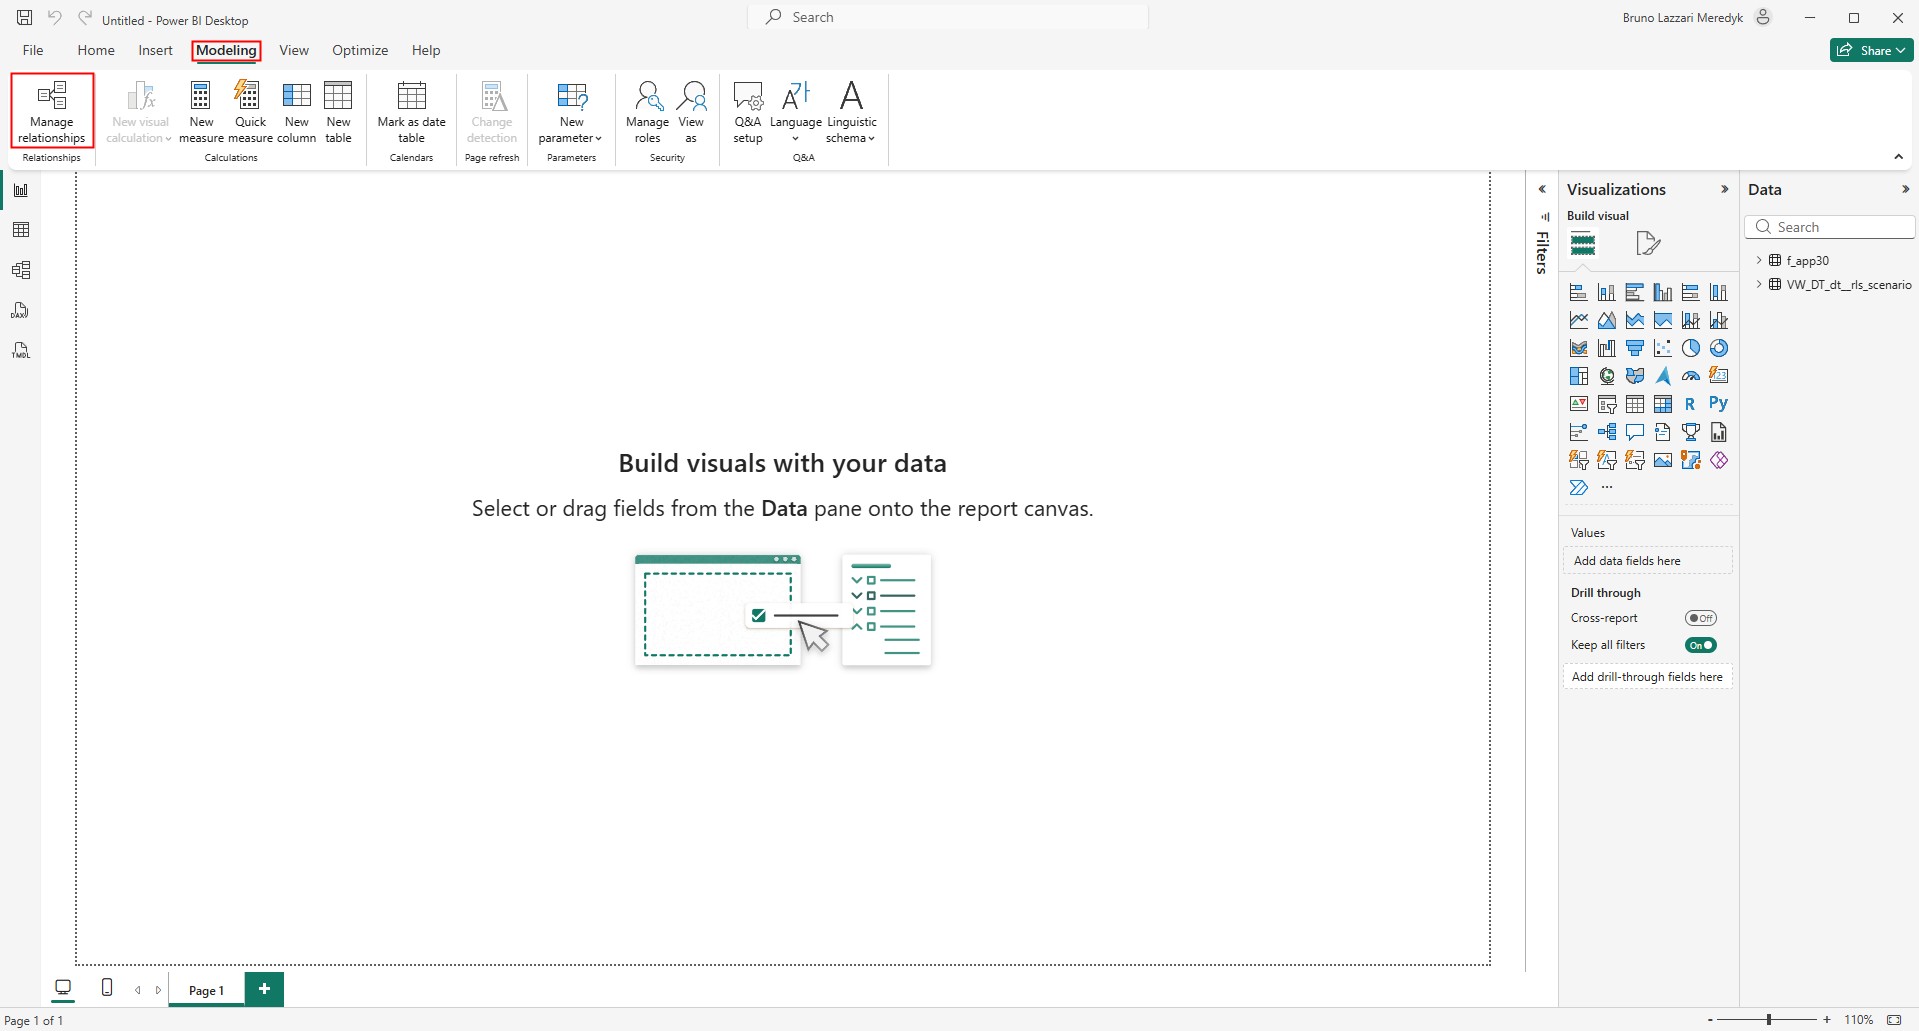
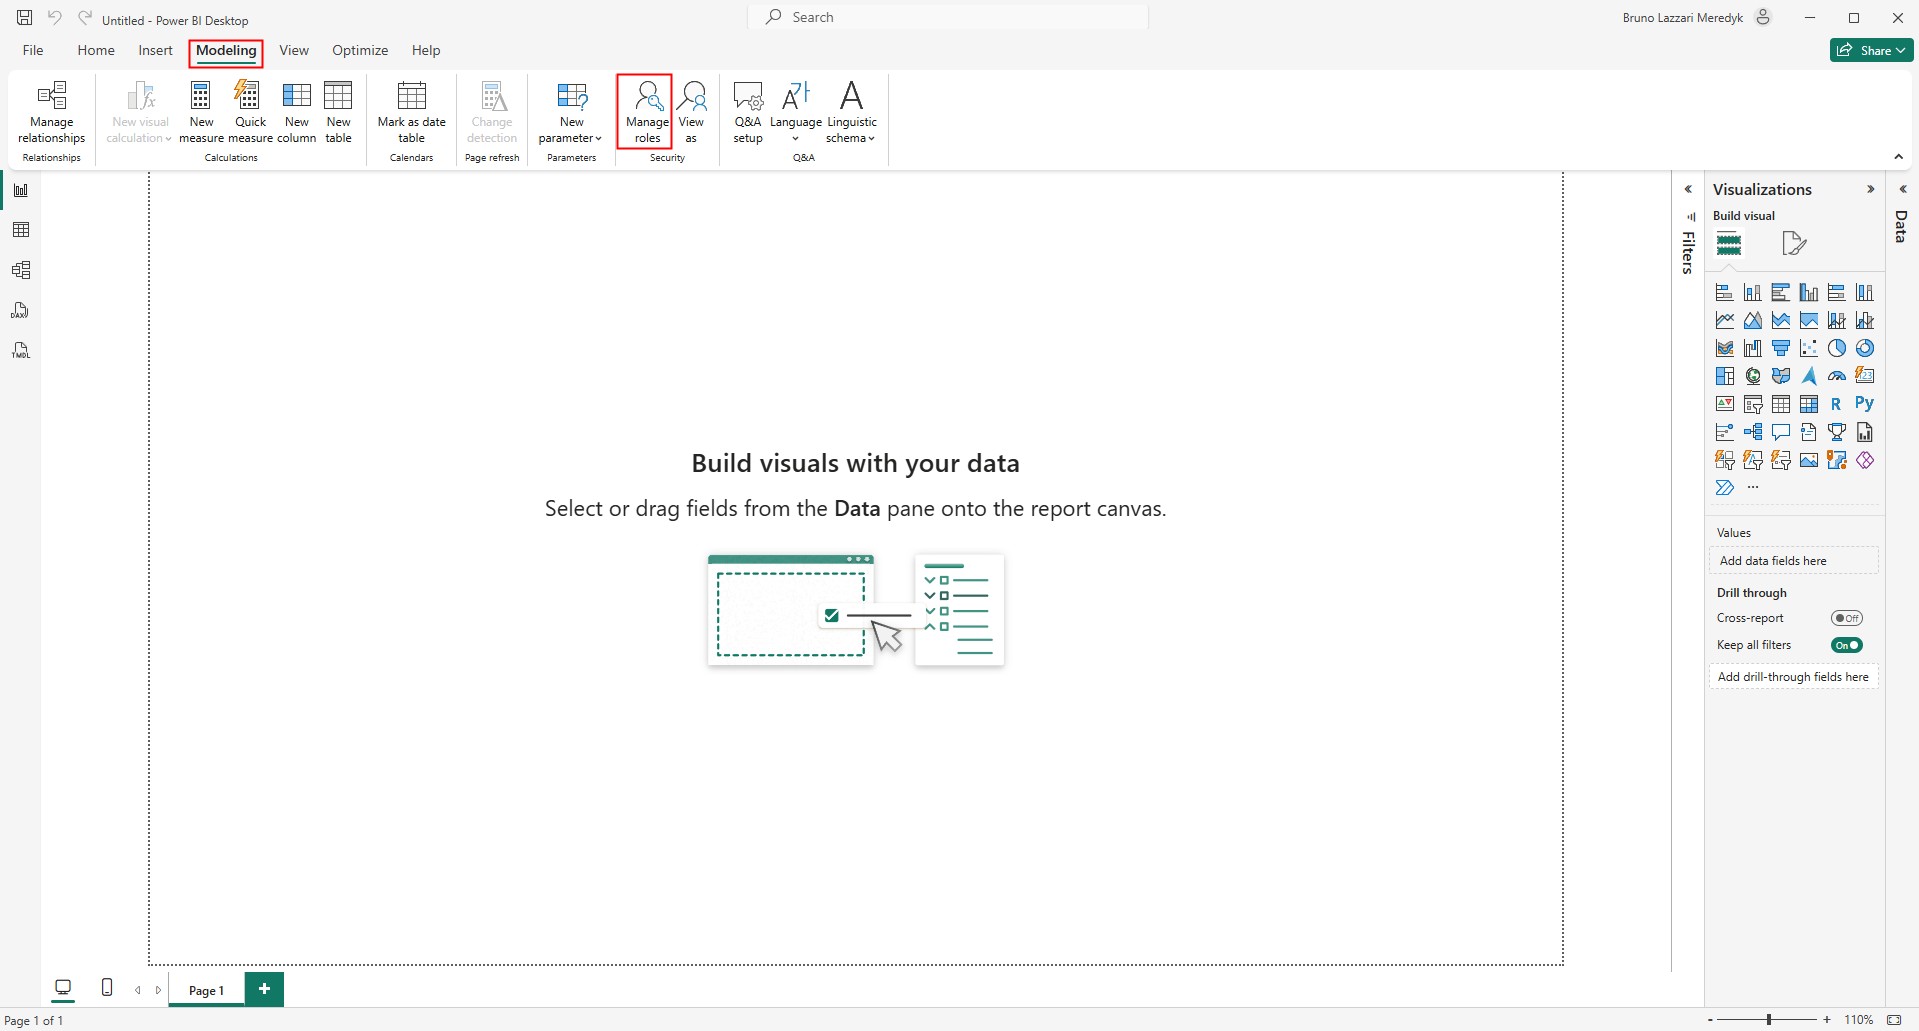
- Inside Power BI Desktop, after accessing your dataset, in the Modeling tab select the Manage Relationships option.
- The Manage Relationships window will open, where we will map the columns.
- Click New Relationship
 .
. - A new window will open where we will define the relationships between columns.
- Click New Relationship
- In the first dropdown, From table:
- Select the data table created in T6 where the user and the filter key were added.
- A preview of the existing columns in the table will be displayed, where we will select the previously added "filter key" column by clicking its name in the header.
- In the second dropdown, To table:
- Select the table that references the application or the dimension that will be used in the report.
- A preview of the existing columns in the table will be displayed, where we will select the column we want to filter by clicking its name in the header.
- In the Cardinality dropdown, select the option Many-to-Many ( : *)*.
- In the Cross filter direction dropdown, select the option Both.
- Keep the checkbox Activate this relationship enabled .
- Enable the checkbox Apply security filter in both directions .
- After finishing the configuration, click Save.
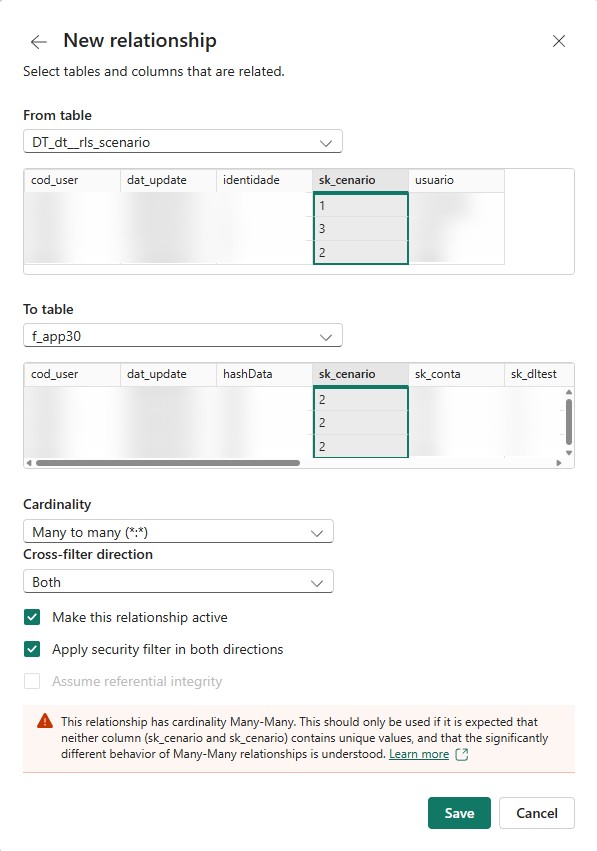
The created relationship will be displayed in the Manage Relationships window listing.

¶ 4.2. Managing Roles
- In Power BI Desktop, in the Modeling tab, select the Manage Roles option, where we will configure RLS.
- The Manage security roles window will open, where we will configure row-level data restrictions.
- Under Roles, click
 .
.
- A new Untitled role will be displayed, which we will rename to ServiceRole.
- On the side, we have the table view, where we will select the table created for RLS configuration (where we have the user and filter key) and click under Filters.
- Three dropdowns will be displayed: Column, Condition, and Value. Click the Column dropdown and select the "user" from the security table.
- Click
 , where we will use the DAX function
 USERNAME()to filter the user in the security table.
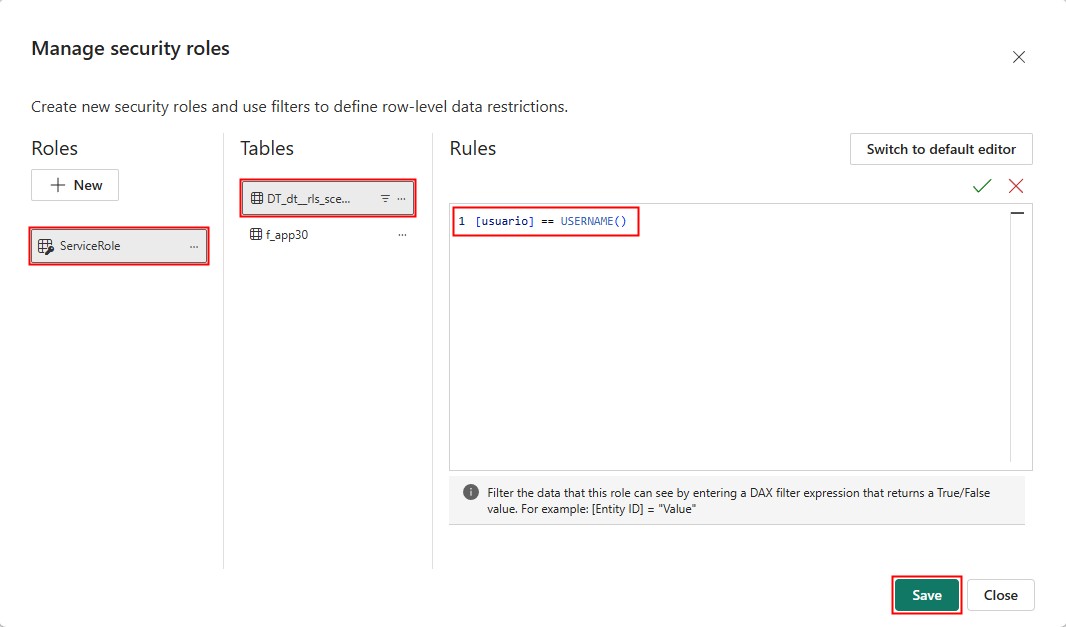
In our example, the user column in the security table is named usuario, therefore, we will have the following expression:
[usuario] == USERNAME().
- Click Save to finalize role creation.
Still in the Manage security roles page, we will create a new role that will serve to identify users who will not be affected by the security restriction, for example, administrator users.
- Under Roles, click .
- A new Untitled role will be displayed, which we will rename to AdminServiceRole.
- The AdminServiceRole will not have any filter applied. Its use will take place directly in the database.
- Click Save to finalize role creation.
For the RLS filter not to be applied to specific users, these users must have the
SendAdminRolerow with valuetruein theREP_USER_CONFIGURATIONtable →
If the value is set tofalse, the RLS filters will be applied to the user.
¶ 5. Report Synchronization
The Synchronize Reports feature keeps T6 objects aligned with the reports existing in the Power BI workspace.
The synchronization is accessed from the Integration tab in the Explorer ribbon, through the Reports option.
¶ 5.1. Reports and Applications
Internally, the metadata of each report is stored in the REP_XML table and is always linked to an Application. Therefore, the synchronization wizard requires you to select an application first: the report list is filtered according to the chosen application.
¶ 5.2. Explorer Folder Parameter
The global parameter Report - Power BI Explorer Folder defines the default destination folder in T6 for synchronized Power BI reports.
This parameter is global, meaning a single default folder can be used by all applications. It can be configured in two ways:
- Directly in Parameters: go to Settings → Parameters → Global → Integration and set the desired folder.
- During synchronization: change the folder in step 1 of the wizard; after saving, the parameter is updated with the last selected folder.
¶ 5.3. Using the Synchronization Wizard
The synchronization wizard follows a two-step process.
¶ 5.3.1. Step 1 — Selection
Open the Integration tab in the Explorer ribbon and click Reports.
- Select the Application from the dropdown menu. The report list reloads, displaying only the reports linked to that application.
- Optionally, change the Folder by clicking the folder icon and selecting a destination in the Explorer tree. The configured global parameter is updated to match your selection.
- Check or uncheck reports in the list:
- Checked : report is synchronized with T6.
- Unchecked : report is not synchronized; selecting it will add it to T6.
- Unchecking a currently synchronized report queues it for removal.
- Click Next to proceed to the review step.
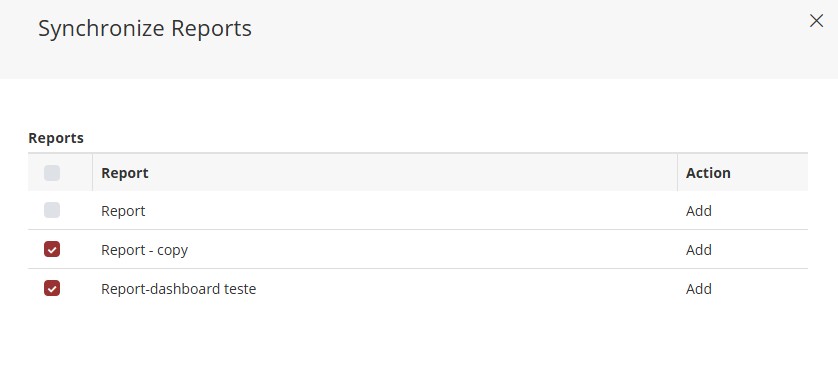
¶ 5.3.2. Step 2 — Review and Confirm
This step displays a list of all proposed changes before they are applied. Each row shows the report name, change details, and the Action that will be executed when clicking Save:
| Action | Description |
|---|---|
| Add | A newly selected report will be created in T6 Explorer inside the configured folder. |
| Rename | The report exists in T6, but its name differs from the source in Power BI. The name will be updated in the REP_XML metadata. The report is not moved. |
| Change ID | The report name is correct, but its internal ID has changed. The ID will be updated in the REP_XML metadata. |
| Change Dataset ID | The ID of the Power BI dataset linked to the report has changed. The dataset reference will be updated. |
| Not found (Remove) | Neither the report name nor ID matched any entry in the source workspace. T6 will remove the report metadata and its Explorer object. |
| Remove | The report was explicitly unchecked in step 1. T6 will remove it from the Explorer. |
Any action can be unchecked to be skipped. Unchecked actions are not executed when clicking Save.
Click Save to apply, or Previous to return to step 1.
¶ 5.4. Synchronization Actions Details
¶ Rename, Change ID, and Change Dataset ID
When T6 detects that the name, internal ID, or dataset ID of a report has changed, it updates only the corresponding metadata. The report object remains in its current folder in T6: it is not moved, deleted, or recreated. All security settings and permissions are preserved.
The Rename, Change ID, and Change Dataset ID actions do not move the report to another folder and do not affect its security configuration in T6.
¶ Removal via Synchronization vs. Deletion in T6 Explorer
These two removal paths have different effects:
| Method | Effect on T6 Explorer | Effect on Power BI |
|---|---|---|
| Synchronization (Remove / Not found) | Object and metadata removed from T6 | No effect — the report remains in Power BI |
| Delete in T6 Explorer | Object removed from T6 | The report is also deleted from Power BI |
If you want to remove a report from T6 while keeping it in Power BI, always use the synchronization wizard — never the deletion action in T6.
¶ Moving a Report to Another Folder
The synchronization wizard does not relocate existing reports. To move a report:
- Drag and drop the report object in T6 Explorer to the destination folder (recommended — preserves all security settings).
- Alternatively, remove the report via synchronization and re-synchronize it in the new folder, but this recreates the object and all security settings will be lost.
If you drag a report to a folder that some users do not have access to, those users will lose access to the report.
¶ 6. Q&A
Frequently Asked Questions
1. What parameters are required to configure the Power BI integration with T6?
- In the T6 Main Menu.
- Go to Settings.
- Under Parameters, in the Global tab, expand the Integration options.
The following parameters must be filled in:
Report - Client Secret.
Report - ClientID.
Report - GroupID.
Enable the Integration switch.
Report - API URL.
Report - Authorization URL.
Report - Resource URL.
Optionally enable the Report - Use RLS switch.
2. What should be filled in the Integration parameters for Power BI?
The content for the Power BI integration parameters will be obtained directly from the system administrator. For more information, visit: Power BI Integration with T6.
3. How do I synchronize Power BI reports with T6?
To synchronize Power BI reports with T6, follow the steps below:
- In the T6 Main Menu.
- Access the Explorer.
- Select the Integration tab.
- Click Reports.
- Select the Application to filter the reports linked to it.
- Optionally, choose the destination Folder in the Explorer.
- Check or uncheck the desired reports and click Next.
- Review the proposed actions and click Save to complete the synchronization.
For a complete breakdown of the steps and available actions, see section 5. Report Synchronization.
4. Can I synchronize the same Power BI report with multiple applications?
Yes, the integration is individual per application, allowing the same Power BI report to be synchronized with different applications.
5. What features do I need to use Power BI reports in T6?
To use Power BI Reports in T6, the user must have the Manager features Synchronize management reports. and Create and view dashboards/maps. and the Planner feature Display the menu bar during report viewing. enabled.
6. How does RLS (Row Level Security) work in Power BI reports?
RLS is used to restrict data at the row level.
To use RLS in Power BI reports within T6, follow the steps below:
- In T6, create a data table linking the user (
coduser) with a filter key (e.g.,sk_cenario,sk_entidade, etc...). - Create a data form pointing to the created table and add the necessary data.
- In Power BI Desktop, create relationships between the security table and the tables that will be used in the report.
- In Power BI Desktop, configure the
ServiceRoleandAdminServiceRolefunctions.
For more details, see section 4. Using RLS in this guide.
7. How do I create a new Power BI report in T6?
To create a new Power BI report in T6, follow the steps below:
- In the T6 Main Menu.
- Access the Explorer.
- Select the location where you want to create the report.
- In the ribbon, under New Item, select the Report option.
- In the side panel, define the name and dataset of the new report.
- Click Save to open the report editing page.
8. What is the difference between Edit and View modes in Power BI reports?
The difference between Edit and View modes in Power BI reports is that Edit mode allows modifying the report, while View mode only allows interacting with existing data, without the possibility of editing.
9. What happens in T6 if I change the report in Power BI?
Changes identified in the Power BI workspace appear in the T6 synchronization wizard as pending actions, such as Rename, Change ID, and Change Dataset ID. After confirmation, T6 updates the report metadata; these actions do not move the object in the Explorer and preserve its security settings.
10. How do I export Power BI reports in T6?
To export a Power BI report while using T6, use the Export button in the ribbon, choose the format (PDF, PPT, PNG), select current/default values, and configure page options.
11. How do I apply filters to reports?
Use Filters in the ribbon for basic filtering (checkboxes) or advanced filtering (operators such as "contains", "is", "starts with" ...).
12. How do I remove a report from T6 without deleting it from Power BI?
To remove a report from T6 without deleting it from Power BI, in the Explorer, access the Integration tab in the ribbon, uncheck the checkbox for the desired report, and save.
By doing so, T6 removes only the object and internal metadata in the Explorer; the report remains in Power BI. Avoid deleting the report directly in the Explorer when the intention is to keep it in the workspace.
13. When should I use "Refresh" vs "Reload" in Power BI reports?
To choose between the options, consider the following:
The Refresh button checks Power BI for new data; if there are changes, the report is updated with the new data. If there are no changes, the report remains unchanged.
The Reload button returns the report to its last saved state (discarding unsaved changes).
14. Why doesn't my Power BI report appear in T6 synchronization?
For the report to appear in T6 synchronization, check the following:
- Confirm that the Power BI integration parameters are correctly filled in T6.
- Make sure the report exists in the configured Power BI workspace.
- Verify that the correct Application was selected in the synchronization wizard.
- Check that the user has the necessary permissions to view Power BI reports in T6.
15. Can I cancel a report export in progress?
Yes. Access the notification related to the ongoing report export and click the Cancel button to stop the process.