¶ 1. Overview
Forms are one of the possible ways to update data within T6. They allow data entry (quantities, percentages, values, etc.) for more detailed and specific planning by the responsible party.
The form is the tool used by Planners and Data Reporting Managers to perform detailed company planning or consolidation data adjustments, respectively.
¶ 1.1. Prerequisites
To be able to create and edit forms within T6, the following requirements must be met:
-
The user must have the Manager feature: Create and View Data Entry Forms enabled;
-
The user must be added to a Global Group, with the Manager feature: Manage Explorer enabled;
¶ 2. Functionalities
Form configuration is done in 8 main steps: defining properties and options, defining dimension members to be displayed, adding related reports, selecting desired dimension relationships, creating calculated members, configuring excluded intersections, defining parameters and formatting
The Related Reports, Dimension Relationships and Calculated Members options are optional.
Forms within T6 Enterprise serve as data windows, allowing users to register and manage information with ease. Each form is designed to be intuitive and adaptable where customers can enter data to feed our analysis model. By configuring your row, column, and page fields, you shape the data structure that makes up each form, allowing flexible customization to meet your specific needs.
¶ 3. Creating and Editing Forms
To create a form within T6, we should follow these steps:
- In the T6 main menu, access the Explorer option;
- Within Explorer, access the folder where we will create our form;
- After accessing the folder, in the ribbon, click on New Item and in the Data-Entry option, select Form;
- With the object created, select it and click Open in the ribbon;
- The form editing page will open, where we will configure our form according to our needs;
¶ 3.1. Properties/Options
¶ 3.1.1 Properties
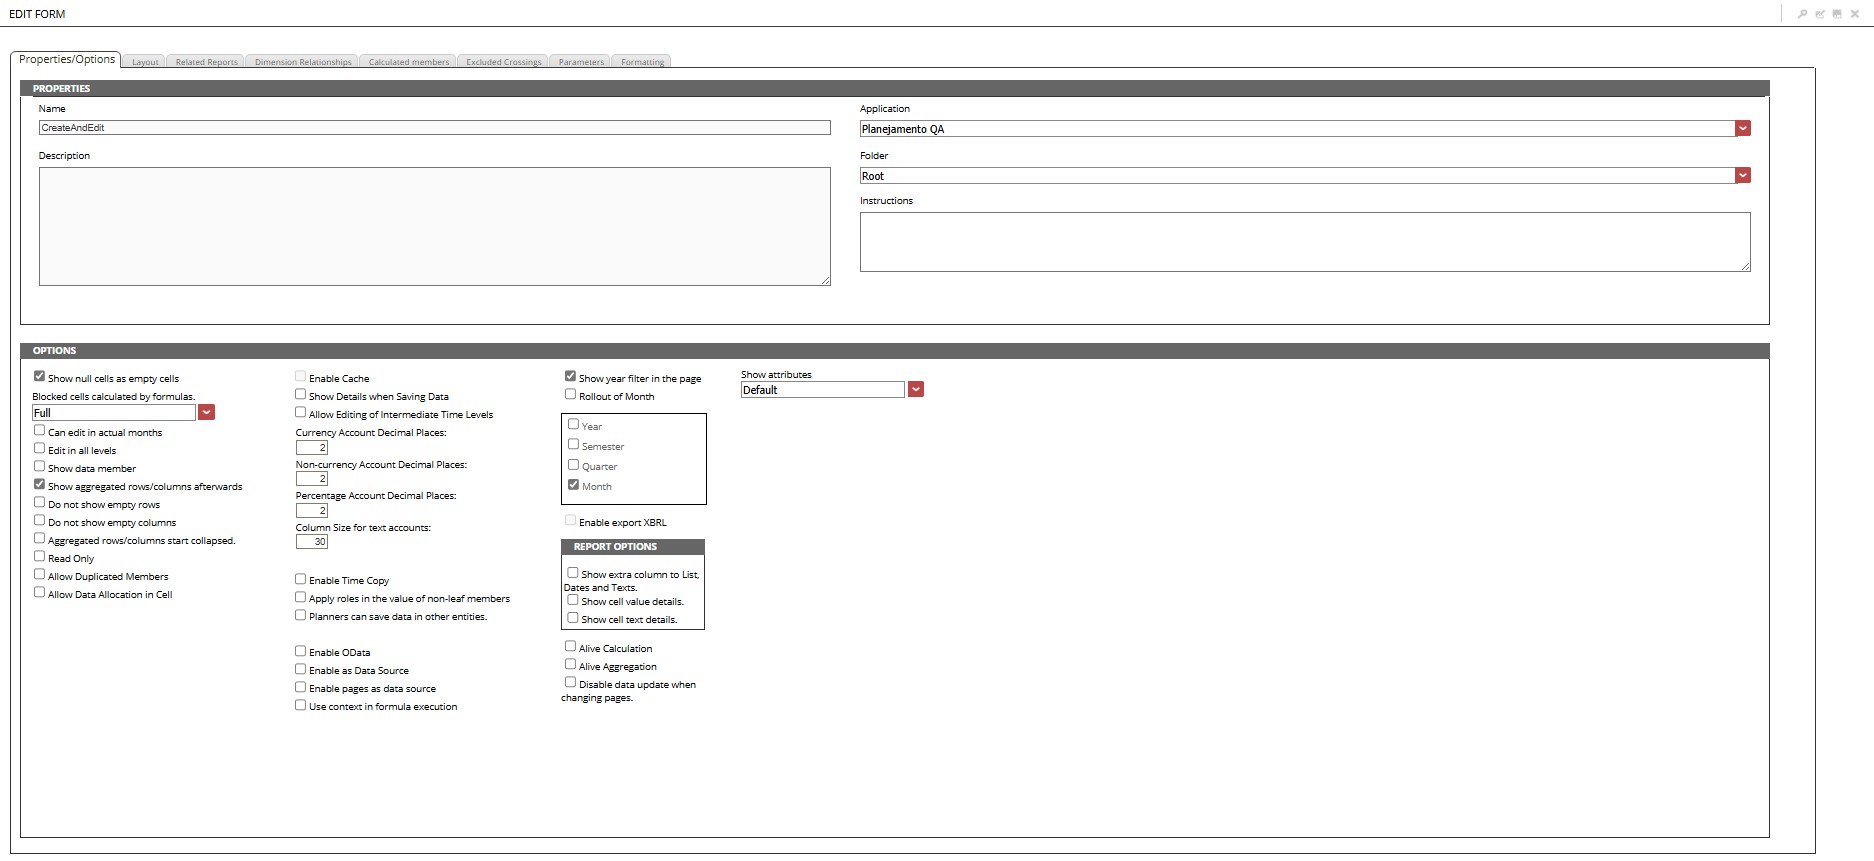
The properties/options tab allows you to define the basic details and form display and interaction options.
- In the Properties step we will define the following fields:
- Name: Field where we will define the display name of our form;
- Application: Field with dropdown, where we will select which application this form will be linked to;
- Description: Field where we can provide a brief description about the form (displayed in the explorer listing);
- Folder: Field with dropdown, where we can change the location where the form will be saved and displayed;
- Instructions: Field where we can provide instructions about the form in question (displayed only when opening the form);
¶ 3.1.2. Options
- In the Options step we will define the following fields:
| Name | Description | Default Value |
|---|---|---|
| Show null cells as empty | When enabled, null cells are displayed without any data | Enabled |
| Lock cells calculated by formulas | We have three options: None, Account and Complete | Complete |
| Allow editing in Actual months | When enabled, allows editing in actual months | Disabled |
| Allow editing at all intermediate levels | Check this option to allow editing values at all levels and not only in leaf members (when enabled, it mandatorily enables the Show member data checkbox) | Disabled |
| Show member data | Check this option to show the member data of all members that have children (If the option above is enabled, the member data will be visible mandatorily) | Disabled |
| Show aggregated rows/columns at the end | Check this option to show total rows below the hierarchy of members that compose its value | Enabled |
| Do not show empty rows | Check this option to not show rows that do not contain any value | Disabled |
| Do not show empty columns | Check this option to not show columns that do not contain any value | Disabled |
| Aggregated rows/columns start closed | Check this option to show the total rows/columns initially closed (increases loading performance in forms with a large number of cells) | Enabled |
| Read only | When enabled, data editing is not allowed | Disabled |
| Allow duplicate members | When enabled, does not allow adding duplicate members | Disabled |
| Allow data allocation in cells | When enabled, opens a box with the options Proportional Allocation, Fill leaf members and Custom, allowing you to select the type of allocation available for the form | Disabled |
| Enable cache | Check this option to enable cache on the first execution of the form, with this the next executions of the same form will take less time | Disabled |
| Show details when saving data | Check this option to view details when saving a form. These details can be Formula Execution, Updating Data, etc. | Disabled |
| Allow changing intermediate levels of time dimension | Check this option to allow editing intermediate members of the time dimension. Examples of intermediate members can be: Semesters, Quarters. | Disabled |
| Decimal Places for monetary accounts | Defines the number of decimal places after the decimal point for monetary accounts | 2 |
| Decimal Places for non-monetary accounts | Defines the number of decimal places after the decimal point for non-monetary accounts | 2 |
| Decimal Places for percentage accounts | Defines the number of decimal places after the decimal point for percentage accounts | 2 |
| Column size for text accounts | Enter the column size for text accounts that will be displayed in the form | 30 |
| Enable Copy in Time | Check this option to replicate the account value in all valid leaf members in the Time dimension | Disabled |
| Apply roles to non-leaf member value | Allows posting values at intermediate levels, allocating the value to leaf members | Disabled |
| Planners can save information in other entities | Check this option to allow other Planners/Data Report Managers, in addition to the one defined in the entity, to enter data in the form | Disabled |
| Enable OData | When enabled, allows the exposure of form data as an OData service, facilitating consultation and integration with other applications, such as BI tools and custom scripts. | Disabled |
| Enable as data source | Allows saving the form as a Data Set in Reporting Server for use in SDP | Disabled |
| Enable pages as data source | Allows saving pages as a Data Set in Reporting Server for use in SDP | Disabled |
| Use context in formula execution | When enabled, the execution of formulas in the form will take into account the cube context | Disabled |
| Show year filter on page | If enabled, displays a new frame with the options Year, Semester, Quarter and Month | Enabled (month enabled) |
| Month Rolling | Check this option to show time starting from the chosen month that will be defined by the time dimension on page (Filter). Only the months from the chosen month on page up to the number chosen for rolling will be displayed (the chosen number must be a multiple of twelve) | Disabled |
| Enable export to XBRL | Check this option to enable the form export button in XBRL standard (The checkbox will only be enabled when there are one or more XBRL models registered in the application.) | Disabled |
| Display extra column for List, Dates and Texts | When enabled, reports will display an extra column for list, date and text type data | Disabled |
| Display cell values | When enabled, reports will also bring the cell values | Disabled |
| Display cell details | When enabled, reports will also bring the cell details | Disabled |
| Live Calculation | When enabled, executes formula calculations in real time when changing any data (used only in basic operations +, -, *, / and in the IFF function) | Disabled |
| Live Aggregation | Allows real-time updating of aggregated values, without the need to refresh the page or reload the form (can only be used in basic operations +, -, * and /) | Disabled |
| Disable data update when changing pages | When enabled, when changing page in the form, inserted/changed data that is not saved will remain until closing or saving the form | Disabled |
| Display attributes | We have three options: Default, Right after members and Right before members | Default |
¶ 3.2. Dimension Layout
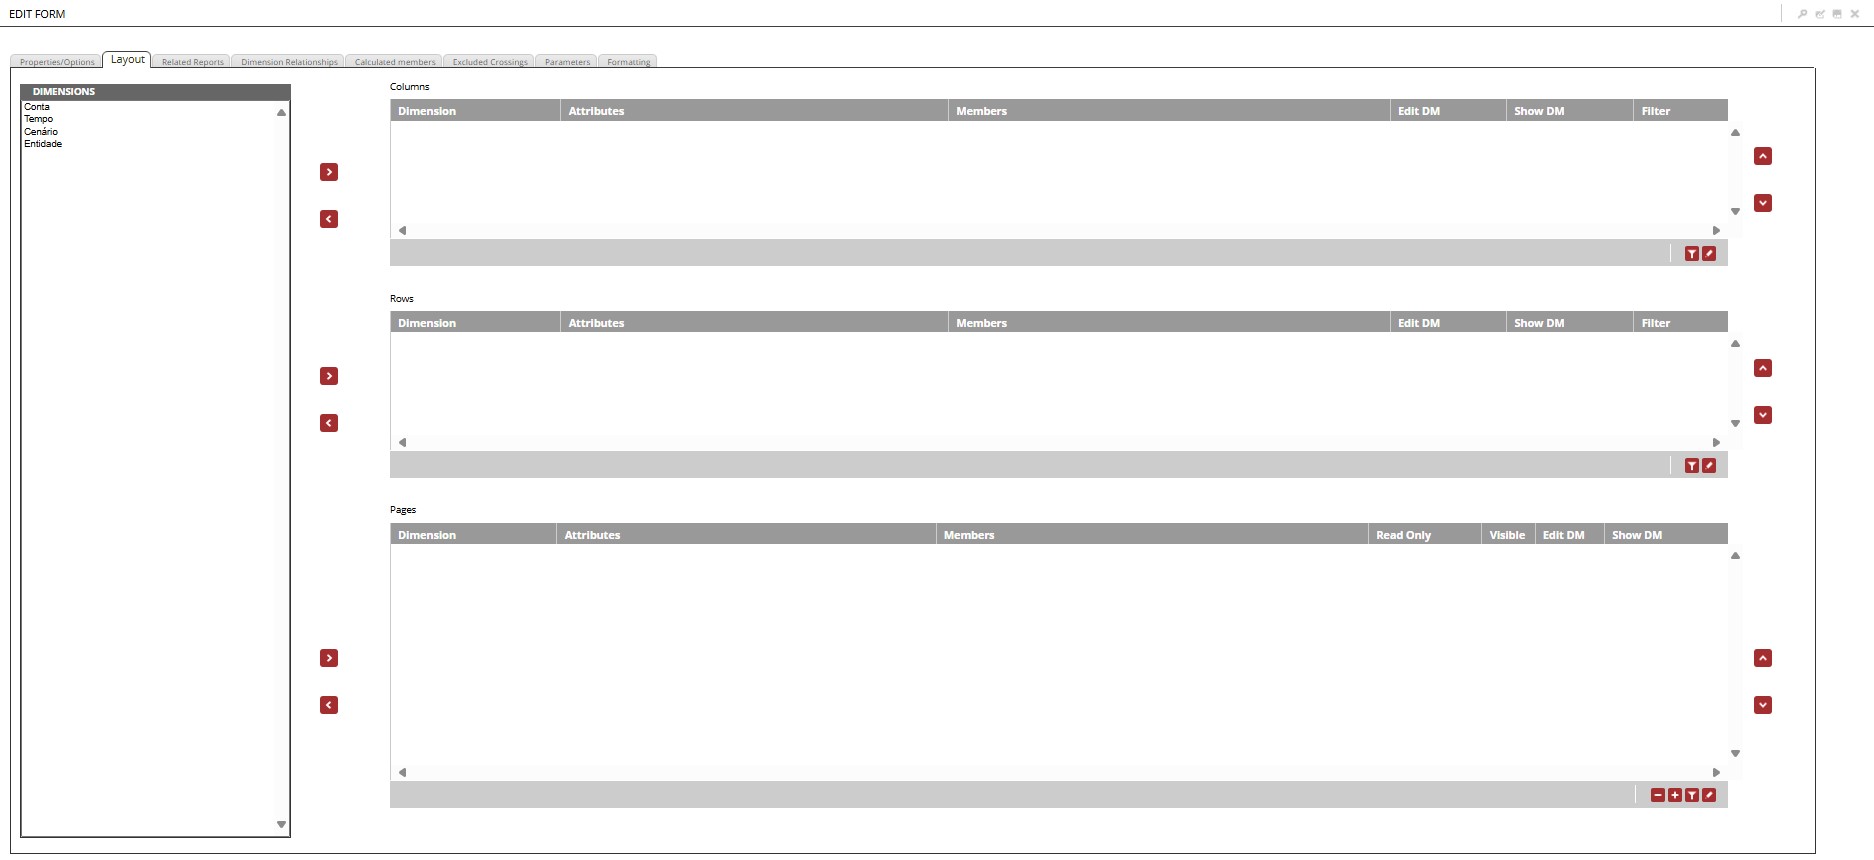
After configuring the form properties and options, the next step is to define how the data will be structured. The layout tab allows you to define the main structure of the form, establishing how data is displayed in the form.
To work with forms, we will need to have at least one dimension arranged in rows and one dimension arranged in columns.
Creating a form is only possible if all dimensions contain registered members.
If our form has, in its row or column layout, more than one dimension, the first dimension displayed will take into account the number of members that will be displayed in the second dimension and will aggregate the cells in the header of the member of the first dimension added.
¶ 3.2.1 Dimensions
The dimension list displays all dimensions available for insertion in columns, rows, pages or restrictions.
All dimensions must be added to one of the form's structural filters (Columns, Rows and Pages).
- Columns: Displays the list of dimensions added in columns for the form. The members defined for each dimension in columns appear in the upper header of the form.
- Rows: Displays the list of dimensions added in rows for the form. The members defined for each dimension in rows appear in the headers on the left side of the form.
- Pages: Displays the list of dimensions added in pages for the form. The members defined for each dimension in pages appear in the selection boxes, in the panel located on the right side of the screen.
In the dimension layout list, we have the following columns being displayed:
| Column | Description |
|---|---|
| Dimension | Name of the dimension added to the list |
| Attributes | List of attributes selected for the added dimension |
| Members | List of members selected for the added dimension |
| Read Only | Check this option to define dimension restrictions for the form |
| Visible | Check this option so that the restriction definition is visible in the form display |
| Edit MD | Check this option to allow editing of Member Data |
| Show MD | Check this option to display Member Data for selected members |
| Filter | Checked option where it shows if there is a filter created for the dimension |
The Read Only and Visible columns are only available for pages.
After distributing the dimensions, we will select the members to be displayed in the form. To do this, double-click on the Member field of the selected dimension, a new window will open where we will make the member selection.
¶ 3.2.2. Member Selection
Allows the selection of members of the selected dimension, using the specified aggregation.
- Hierarchy: Displays the list of hierarchies available for the selected dimension.
This option will not be available for dimensions that do not have hierarchies created.
- Available members: Displays the list of members available for selection;
- Aggregation: Select the type of aggregation to be applied to the selected members;
¶ 3.2.2.1 Aggregation Types
In the aggregation types, we will have some options where Children or Descendants appear.
Children: Are members located directly one hierarchical level below the selected member;
Descendants: Are all members found in hierarchical levels below the selected member;
For example: We are creating a form that uses the Entity and Time dimensions, which have the following hierarchical structures:
Entity Dimension

Entity (level 0)
  ├── Company-1 (level 1)
  │        ├── South Region (level 2)
  │        │       └── South Branches (level 3)
  │        │             ├── Florianópolis Unit (level 4)
  │        │             ├── Porto Alegre Unit (level 4)
  │        │             └── Curitiba Unit (level 4)
  │        └── Southeast Region (level 2)
  │                └── Southeast Branches (level 3)
  │                      ├── São Paulo Unit (level 4)
  │                      ├── Rio de Janeiro Unit (level 4)
  │                      └── Belo Horizonte Unit (level 4)
  ├── Company-2 (level 1)
  │        ├── North Region (level 2)
  │        │       └── North Branches (level 3)
  │        │             ├── Manaus Unit (level 4)
  │        │             ├── Belém Unit (level 4)
  │        │             └── Porto Velho Unit (level 4)
  │        └── Central-West Region (level 2)
  │                └── Central-West Branches (level 3)
  │                      ├── Brasília Unit (level 4)
  │                      ├── Goiânia Unit (level 4)
  │                      └── Campo Grande Unit (level 4)
  └── Company-3 (level 1)
           └── Northeast Region (level 2)
                   └── Northeast Branches (level 3)
                         ├── Salvador Unit (level 4)
                         ├── Recife Unit (level 4)
                         └── Fortaleza Unit (level 4)
Time Dimension

All (level 1)
   └── 2024 (level 2)
         ├── 1H/24 (level 3)
         │	   ├── Q1/24 (level 4)
         │	   │	 ├── January/24 (level 5)
         │	   │	 ├── February/24 (level 5)
         │     │	 └── March/24 (level 5)
         │	   └── Q2/24 (level 4)
         │		     ├── April/24 (level 5)
         │		     ├── May/24 (level 5)
         │		     └── June/24 (level 5)
         └── 2H/24 (level 3)
               ├── Q3/24 (level 4)
              │	  ├── July/24 (level 5)
              │	  ├── August/24 (level 5)
               │	  └── September/24 (level 5)
              └── Q4/24 (level 4)
                   ├── October/24 (level 5)
                   ├── November/24 (level 5)
                   └── December/24 (level 5)


.
In the example above, in the Entity dimension, our Root Member is the Entity dimension itself, which is at level 0, and the members at level 4 are the Leaf Members.
In the Time dimension, our Root Member is the dimension itself, which is at level 0, and the members at level 5 are the Leaf Members.
Click to display available aggregation options
The aggregation types Previous (Relative to Root) and Next (Relative to Root) will only be used in dimensions where we have more than one member at level 1.
To use the aggregation types that mention Member Data, it will be necessary to enable the flag Show Member Data in step 3.1.2. Options.
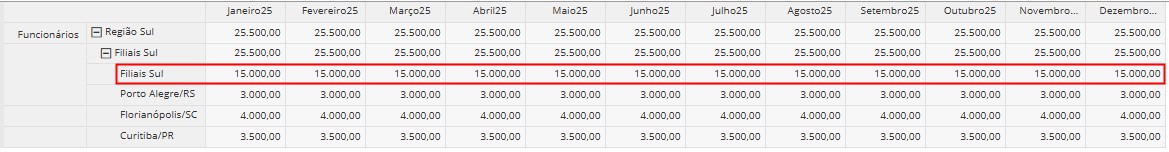
To exemplify Member Data, we will use a form where we have employee expenses in the South Region of a company in the year 2025.
We can define a "fixed value" for our South Branch, which will be part of the final calculation when aggregating the values of its children (SC, RS and PR). To do this, we will need to enable the flag Edit MD next to the selected dimension and also enable the flag Show Member Data in step 3.1.2 Options.
Consider that the company has a monthly expense with employee salaries and vacations, however, monthly the company reserves 15,000 for possible eventual expenses with employees in the South Branches, this value is calculated as Member Data. In the form display, we will have the values of Employee Salaries and Vacations added to the Member Data value defined in South Branches, therefore, when viewing the form we will have the following display:
 ↓
↓
In the available members list, we will select the member we wish to add to our form and its aggregation type and then click on ![]() to add it to the Selected Members list.
to add it to the Selected Members list.
We can choose to not select specific members in the layout step, if you do not select any member, the form will display all members registered in the selected dimension;
- Selected Members: Displays the list with the selected members and the applied aggregation type;
To remove a member from the selected members list, simply select the member and click on
.
Still in the member selection screen we have the Attributes tab, which allows us to select the attributes for the selected dimension.
- Attribute selection is divided into two areas, Filter and Display;
¶ 3.3. Related Reports
This step is optional and allows the association of reports to the form to enrich data analysis.
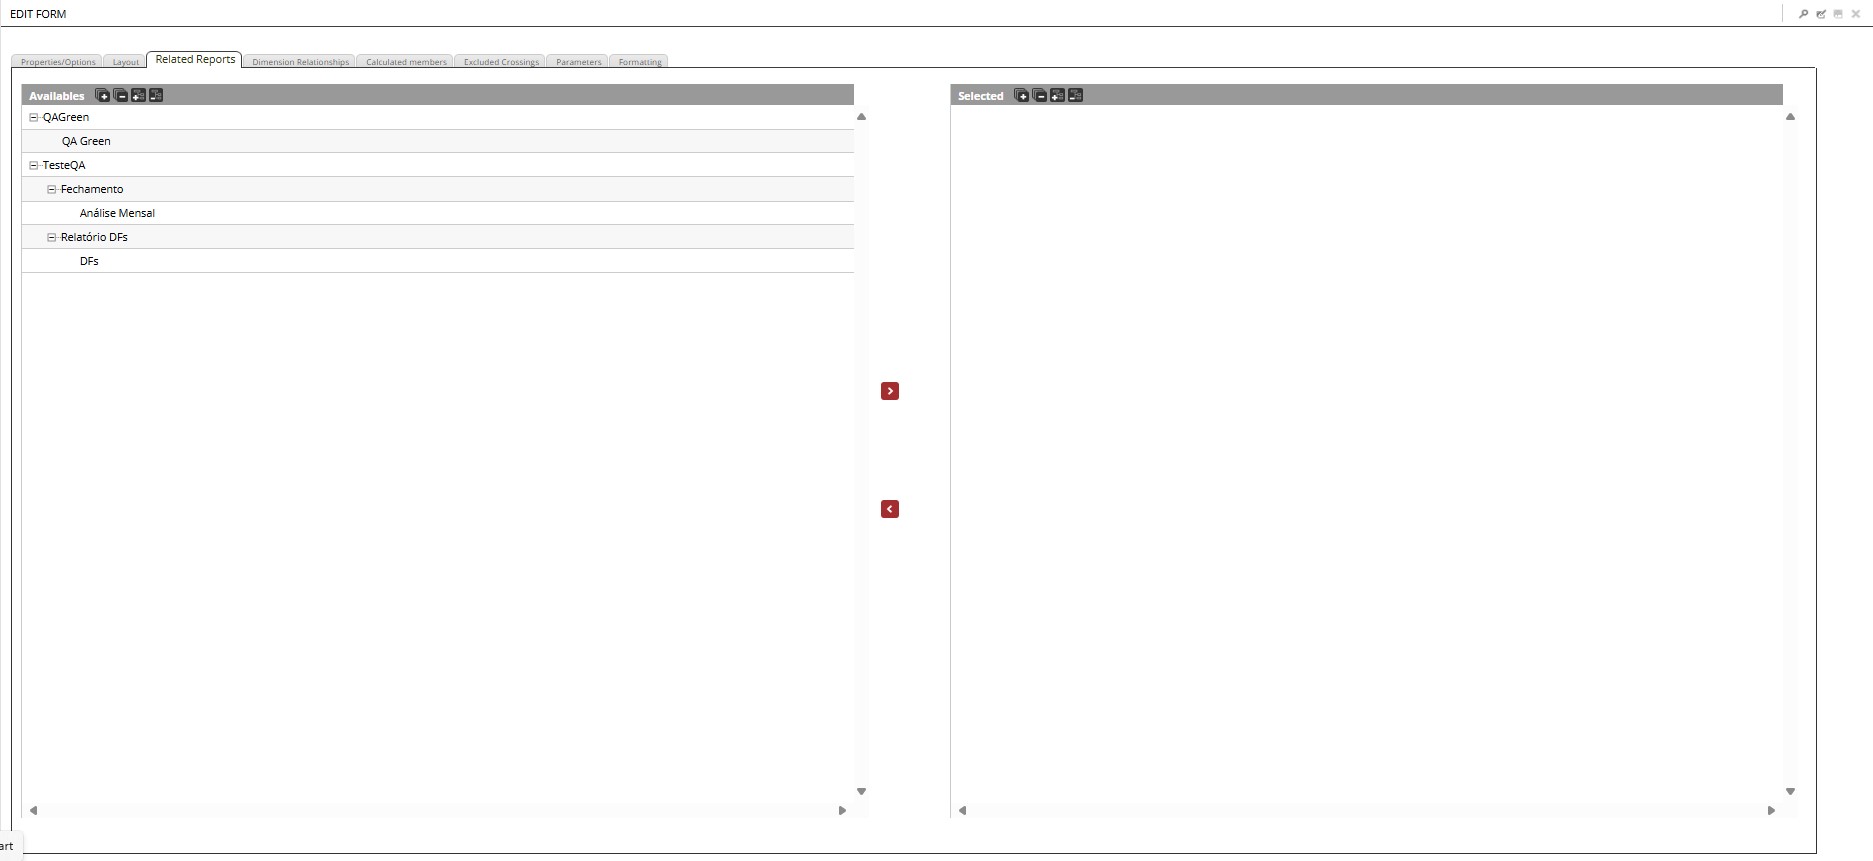
When we have registered reports, they are displayed in the list of reports available for linking with the form. To add a report, click on ![]() . If you want to remove an added report, click on
. If you want to remove an added report, click on ![]() .
.
¶ 3.4. Dimension Relationships
This tab allows the selection of dimension relationships created in the application model administration. Dimension relationships help filter and contextualize the data presented in the form.
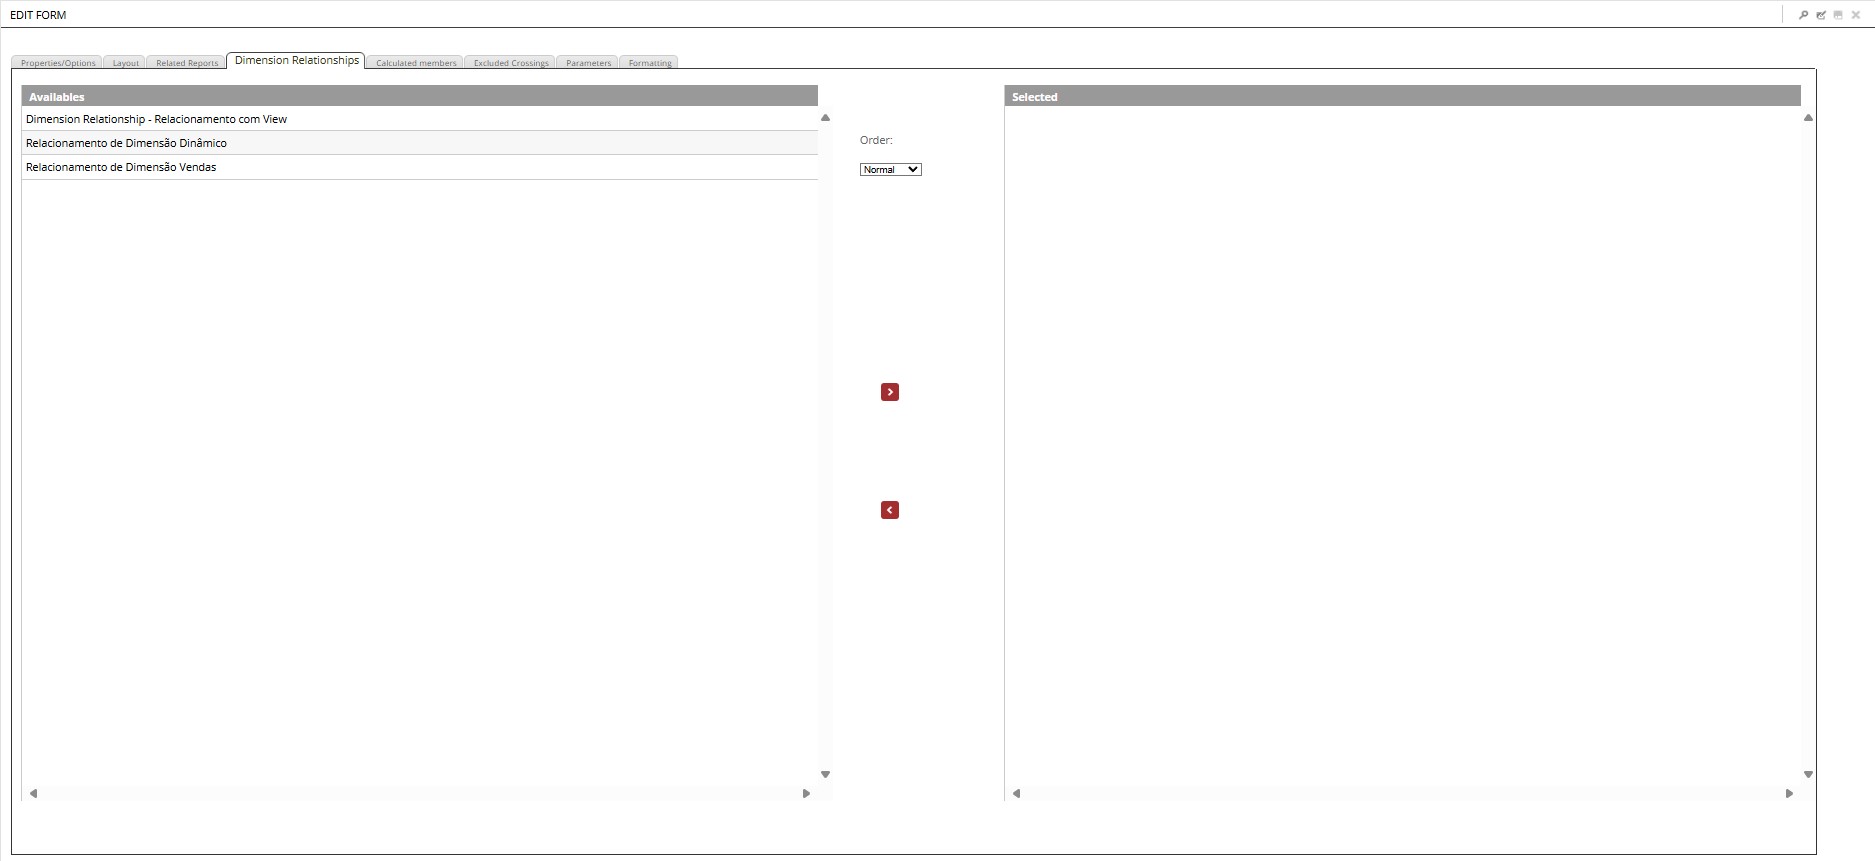
We have a list displaying the dimension relationships available for selection. To add a relationship to the form, click on ![]() . To remove a relationship added to the form, click on
. To remove a relationship added to the form, click on ![]() .
.
For additional information, access: Dimension Relationships.
¶ 3.5. Calculated Members
This functionality enables the creation of simple calculations between dimension members without the need for creating complex formulas.
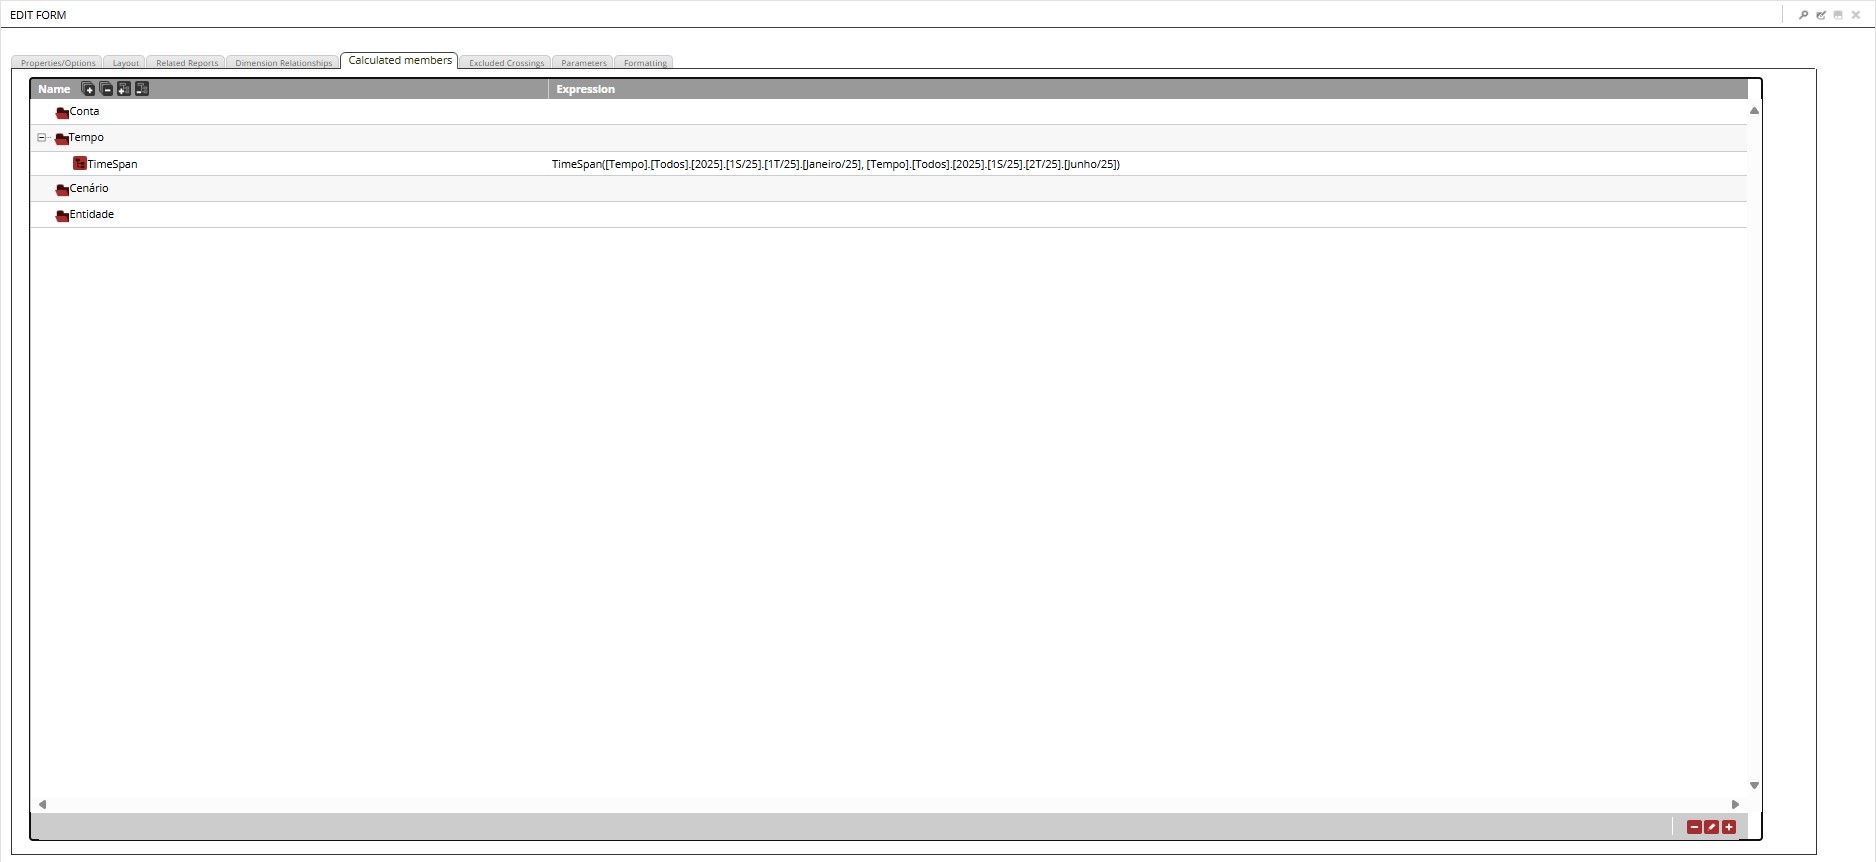
For additional information, access: Calculated Members.
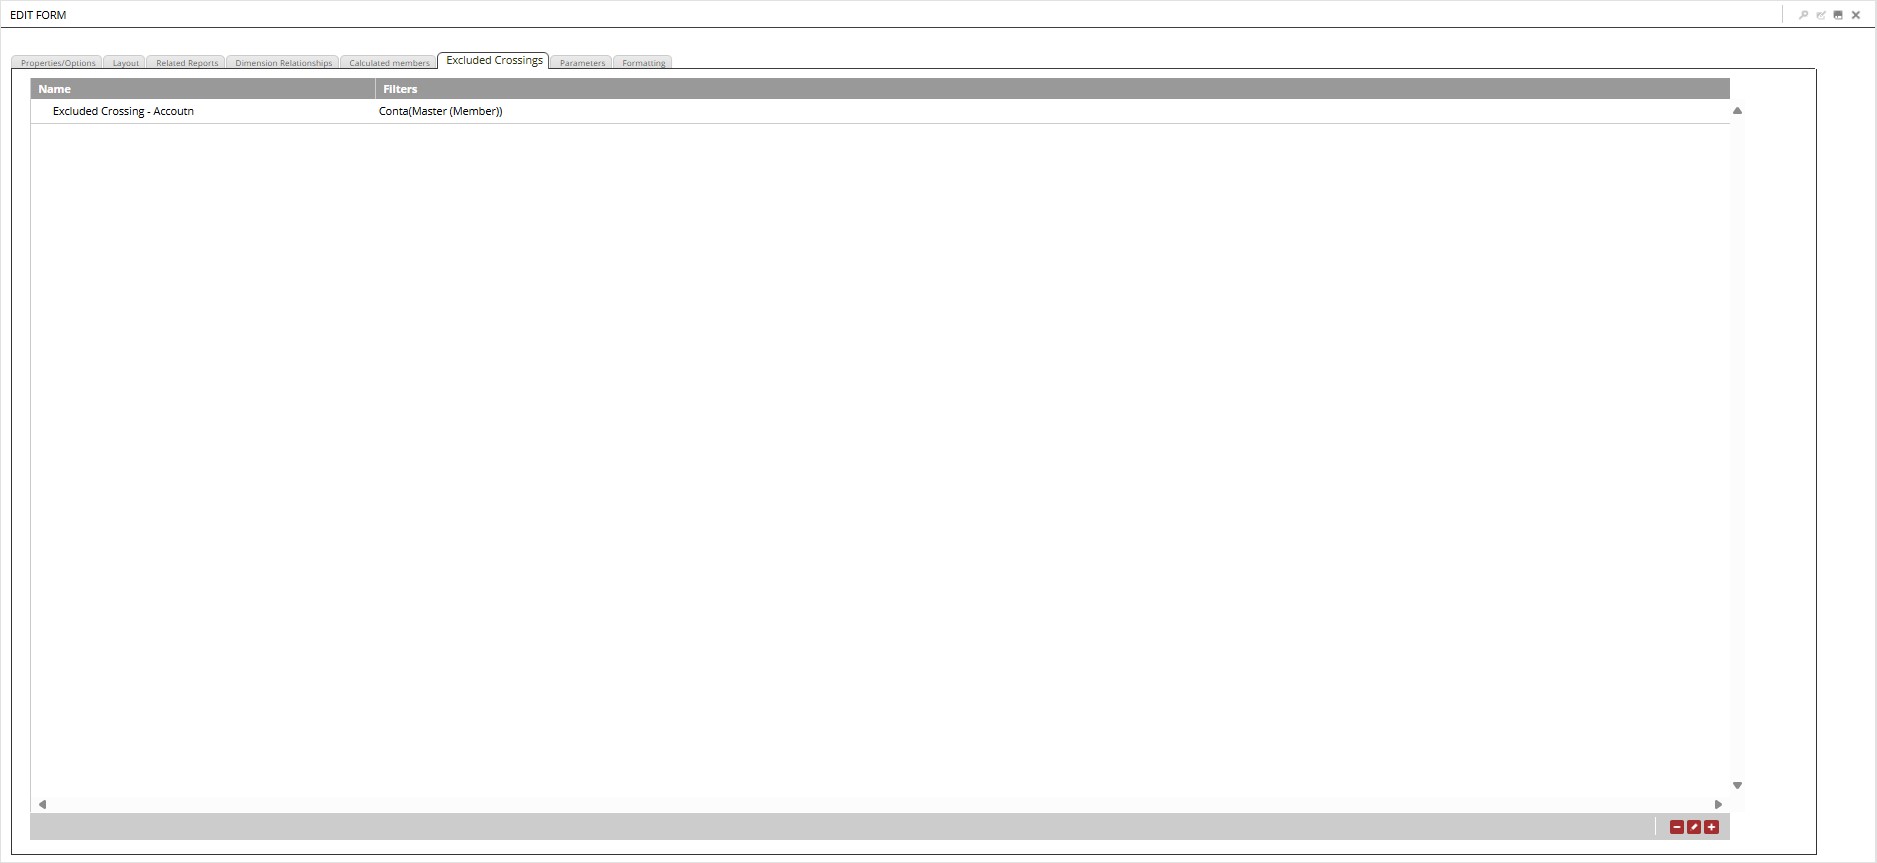
¶ 3.6. Excluded Crossings
This functionality allows the creation, editing, and removal of intersections/combinations between members and dimensions for simple calculations between dimension members.
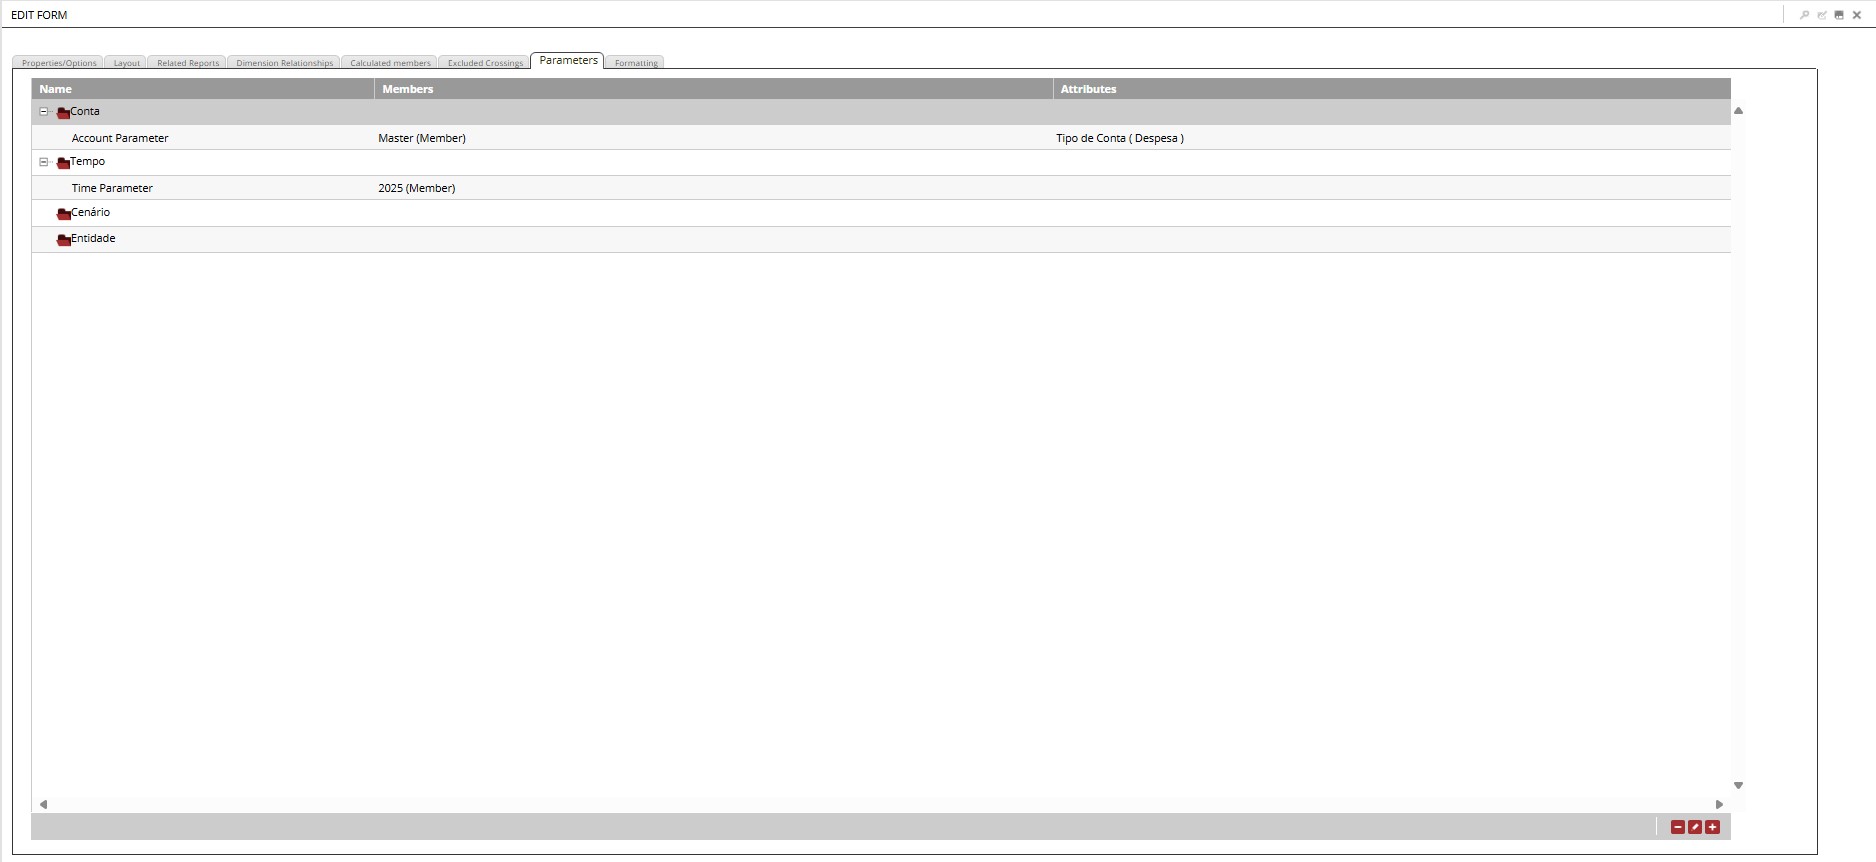
¶ 3.7. Parameters
This functionality allows filtering the dimension members of the form in a more specific way, helping to reduce its scope or allowing other views in a practical and intuitive way. Thus, the user can change, for example, the base year or the planned scenario without having to edit the form, as these parameters can also be used in calculated members.
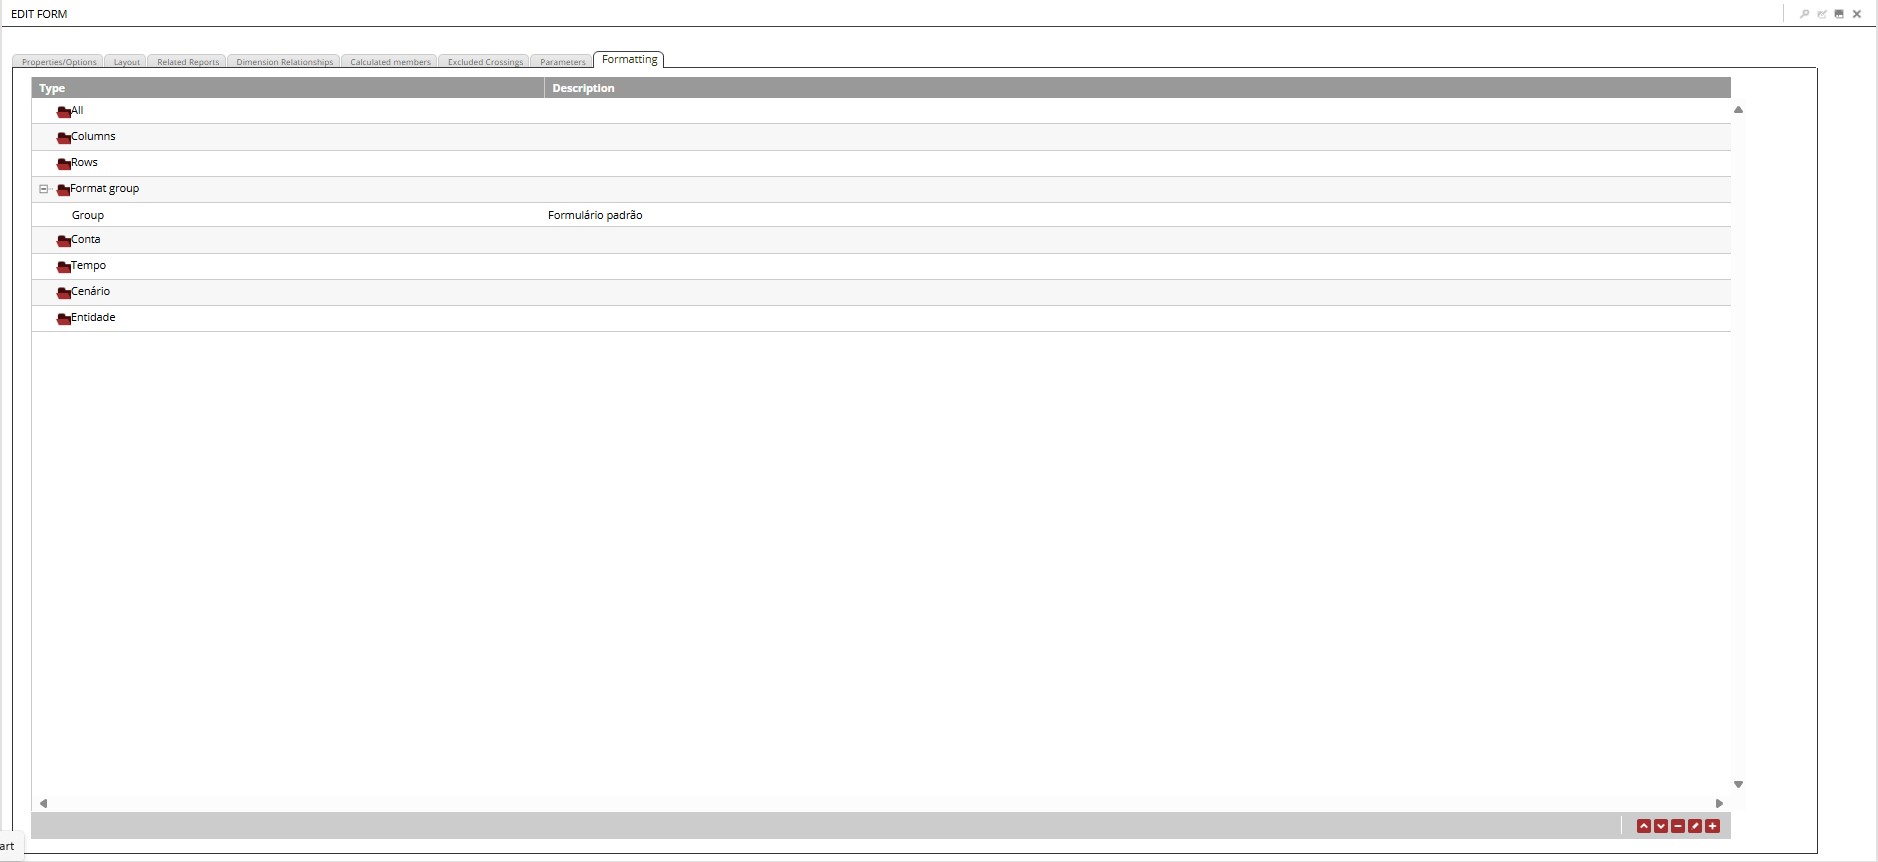
¶ 3.8. Formatting
This functionality allows formatting forms with changes to fill colors, font, background, and borders of headers or values. It is also possible to direct these formatting options to all or some specific items such as rows, columns, dimensions, or members.
From version 12.0 onwards, all forms created will have a default formatting group, if this is deleted, the form will be displayed without any type of formatting.
For additional information, access: Formatting.
After completing the form configuration we will need to save it, to do this, we will click on the floppy disk icon, in the upper corner of the page:
¶ 4. Adding Images to Forms
¶ Configuring the Environment for Adding Images
To add images to forms, we will need to create a new attribute in some dimension of our application.
Adding attribute:
- In Explorer, access the Dimensions folder of your application;
- Select the desired dimension and click Edit in the ribbon;
- Click on the plus sign (+) in the lower corner of the page;
- A new window will open, in which we will name and define the attribute type;
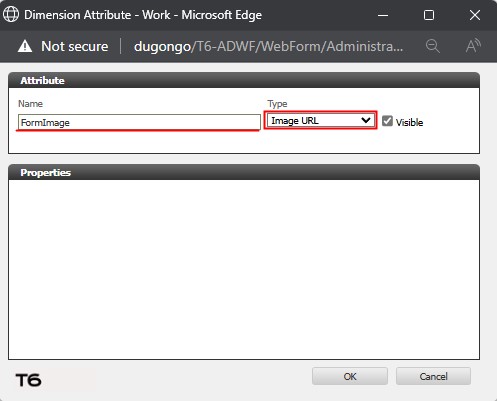
- In the Name field, add a name for the new attribute to be created;
- In the Type field, click on the dropdown and select the URL for image option;
- Click Ok to close the creation window;
- Click Save to complete the creation of the URL for image attribute;
Adding images to the form is done through the properties of a dimension member. Therefore, access the T6 main menu, in the Modeling field and select the Designer option.
- In Application, click on the dropdown and select the desired application;
- In Hierarchy, click on the dropdown and select the dimension in which the URL for image attribute was created;
- Select a member from the dimension and click on Tools → Show Properties;
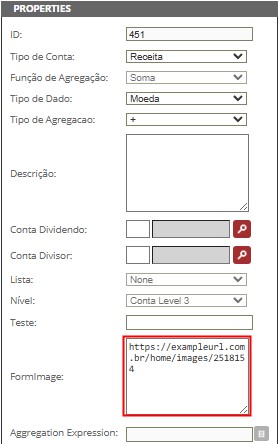
- A panel will open on the side displaying the properties of the selected member, where we will have a field with the name of the attribute created previously;
- In the URL for image attribute field, we will add the complete URL (protocol/domain/path) of the image we want to add:
https://exemplodeurl.com.br/home/images/2518154
The added image will only be displayed if the URL informed in the property field is compatible with the communication protocol and domain previously added in the Image Host Addresses parameter (for additional information, access: Parameter Configuration).
- After adding the URL, click Save;
- To complete, we must publish the cube.
To view the images added to our form, we will select the form and click Edit in the ribbon:
- In the first tab, Properties/Options, we have the Display Attributes option, where we will define where the added image will be displayed: Before the member or After the member (the default display is after the member);
- In the next tab, Layout, we will distribute the dimensions in our form;
For the added images to be visible, it is necessary that the dimension containing the UrlImage attribute be added in Row or Column.
- Select the dimension that contains the UrlImage attribute and double-click or click on
 ;
;
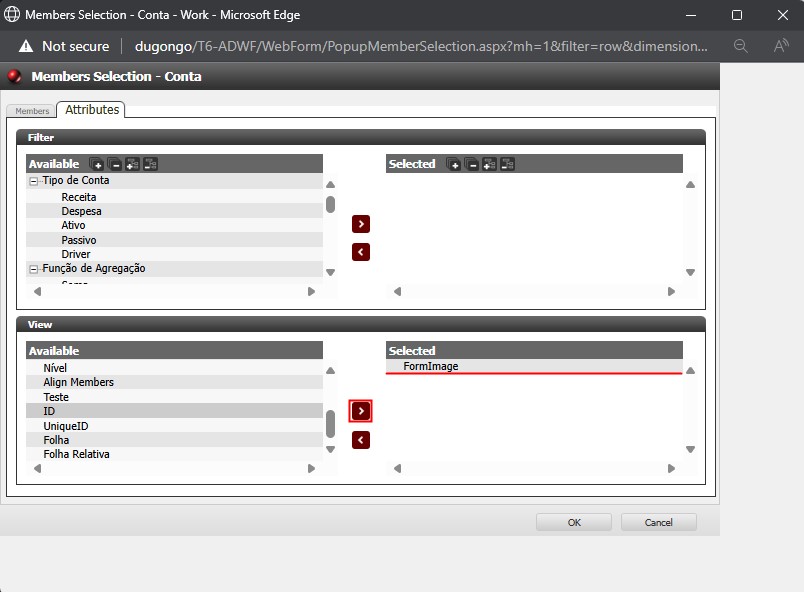
- A new window will open for member selection, with two tabs: Members and Attributes;
- In Members, select the member that contains the image URL added in the properties, select the aggregation type and click on
 ;
; - In Attributes, we have the Display field. Locate in the list the attribute created previously for adding images and click on to add it and click OK;
- After completing the distribution of dimensions and adding the necessary members and attributes, save by clicking on
 ;
;
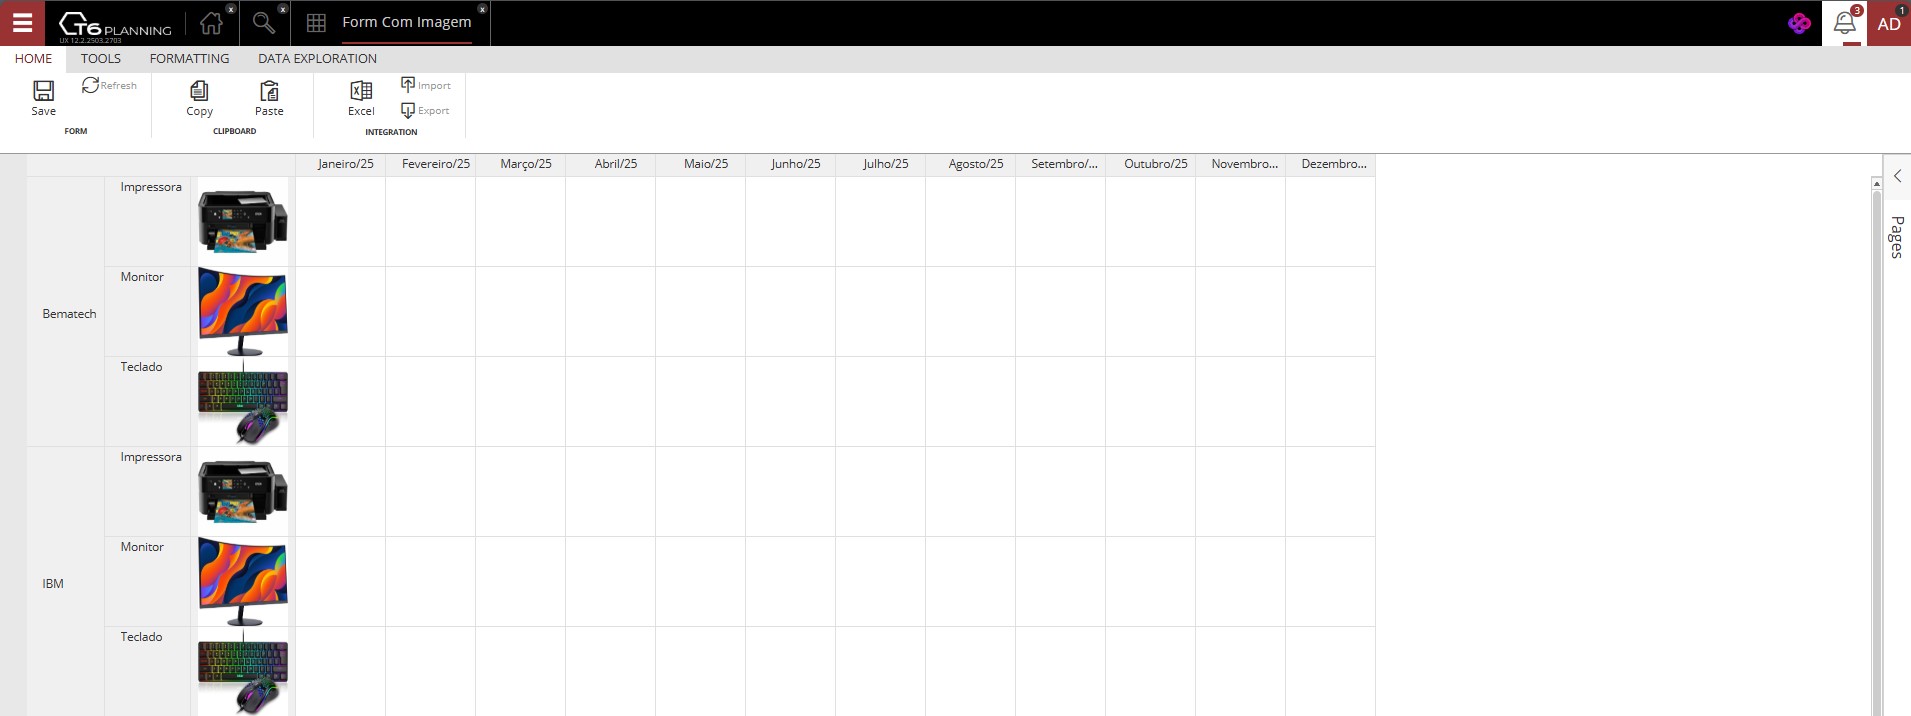
- When we open the form, we will have the added images being displayed according to the previous settings.
Example: